One of the things we may take for granted is that you all - the readers - always realize that we're sentiment analysts, first and foremost. But in looking back over the last few hundred columns, I realize that we haven't talked a whole lot about how we use sentiment data (or even what it is, for that matter). So today, we'd like to give you a meaningful explanation of what we mean by sentiment, and why we find it such a useful tool. The best part is, we'll be using a real-life current example to illustrate the concept.
In my book's glossary, I define sentiment analysis as "the study of indicators focused on measuring investor emotions like fear and greed in an effort to assess when the crowd has over-reacted in a particular direction - generally used for contrarian strategies at major market extremes."
That definition still rings true, and probably always will.
Of the various sentiment indicators everyone has access to (for free), the CBOE equity-only put/call ratio is still my favorite, while my own version of the Rydex ratio is near the top of the list too. But there are dozens - maybe hundreds - of other ways to spot extremes in the market where a reversal is imminent. Consumer confidence surveys can also highlight the times when things have gotten a little out of hand, in both bullish and bearish ways. We don't normally look at these monthly surveys, since we're focused on a shorter timeframe. However, the monthly Michigan Consumer Sentiment Index can serve a similar function for longer-term trading. And yes, it works.
The Michigan Consumer Sentiment Index is as straightforward as it sounds. It measures the general confidence level regarding the economy, market, opportunity, prices, etc., with a baseline that began at 100 decades ago. A high and/or rising score is usually considered a positive, while a low or falling score is generally seen as a negative. Although it's not exactly market or economic data, it's still treated as such. Therefore, since the data is applied to stocks by the media, we too want to know the results of the survey. After all, stocks only move up and down when investors feel good about owning them, or see the need to sell them.
But here's the rub.....we've seen that you're far better off doing the opposite of the obvious. That's what we meant when we described sentiment analysis as particularly useful for contrarian analysis. Rather then go wildly bullish when the Michigan Sentiment Index reaches new multi-year highs, we're probably more apt to get bearish. Conversely, when the index falls to rock-bottom levels and everyone is supposed to be terrified of the market, we're probably looking at buying stocks. Is that the opposite of what the talking heads on TV are telling you? Yep. But a study of the historical readings of the Michigan Sentiment Index will indeed reveal that being a contrarian has been far more profitable than being a lemming.
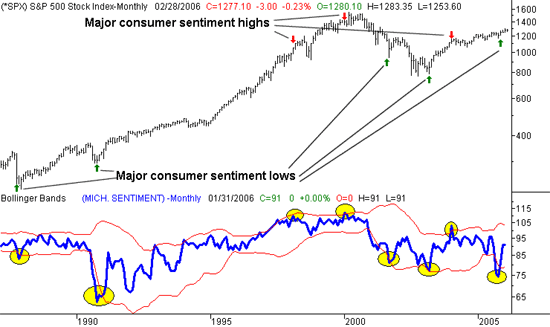
We went back and compiled all the Michigan survey readings, and plotted them on a chart in comparison to the S&P 500. It's a real eye-opener, even with just a quick glance. Take a look at the chart below. Extreme lows in the consumer sentiment index are highlighted, as are extreme highs. The corresponding points are highlighted on the S&P 500 chart. You can see (immediately) that major market bottoms were being made when sentiment was the worst. And tops were being formed when people were most optimistic. Take a look at the chart, then read on for the details.....
S&P 500 versus Mich. Sentiment Index - monthly

On our chart, there are five major low points for the sentiment index.....with one of them being just last October. In the first four cases, the average gain of the S&P 500 over the next six months was 13.7%, and since October's rock-bottom reading, we're up 2.2%. There was not a single negative six-month return once we got any major sentiment low.
What about when the Michigan Sentiment Index was hitting new highs? We saw three major peaks......February of 98, January of 2000, and January of 2004. The average return over the next six months was a 2.9% loss. The only positive six-moth return occurred after the January 2000 peak, and we all know how that ultimately turned into a disaster.
Surprised? Don't be. Most sentiment index data is a reflection of where the economy/market/employment was six months ago, not where it will be six months from now.
A couple of things to keep in mind.....
First, there were only eight 'extremes' that we saw over the last 20 years. That's not a lot, so don't plan on using this tool if you're trying to day trade. These are longer-term signals. However, they're good signals if you'd like to utilize longer-term instrument like leveraged mutual funds or long-term options and LEAPS.
Second, this is tough to systemize, and we had the gift of hindsight. Although sentiment hit a new multi-year low in September of 2001, it had also hit a new multi-year low (at the time) in April of 2001. So, it's difficult to pinpoint exactly when fear and worry has finally hit its absolute bottom. That's why we also applied Bollinger Bands to the chart, and a wise trader would also apply other technical indicators along with this strategy.
The point is, don't buy into what you hear on TV or read in the papers. The market will rarely respond in the way that seems the most superficially logical. In fact, it usually does the opposite. It's tough to use that kind of faith, as you're usually standing alone as a contrarian. But hopefully, this chart will remind you that it rarely pays to bet on the obvious.
Price Headley is the founder and chief analyst of BigTrends.com.