| The Wagner Daily ETF Report For February 26 |
| By Deron Wagner |
Published
02/26/2014
|
Stocks
|
Unrated
|
|
|
|
The Wagner Daily ETF Report For February 26
Stocks closed in negative territory on Tuesday with small losses across the board in the major averages. Although it was an uneventful day for the averages, it was an explosive day for one of our stock holdings, as Tesla ($TSLA0 ripped 16% higher on big volume. We remain long from our December 31 entry of $148.76, giving us an unrealized gain of +66% so far.
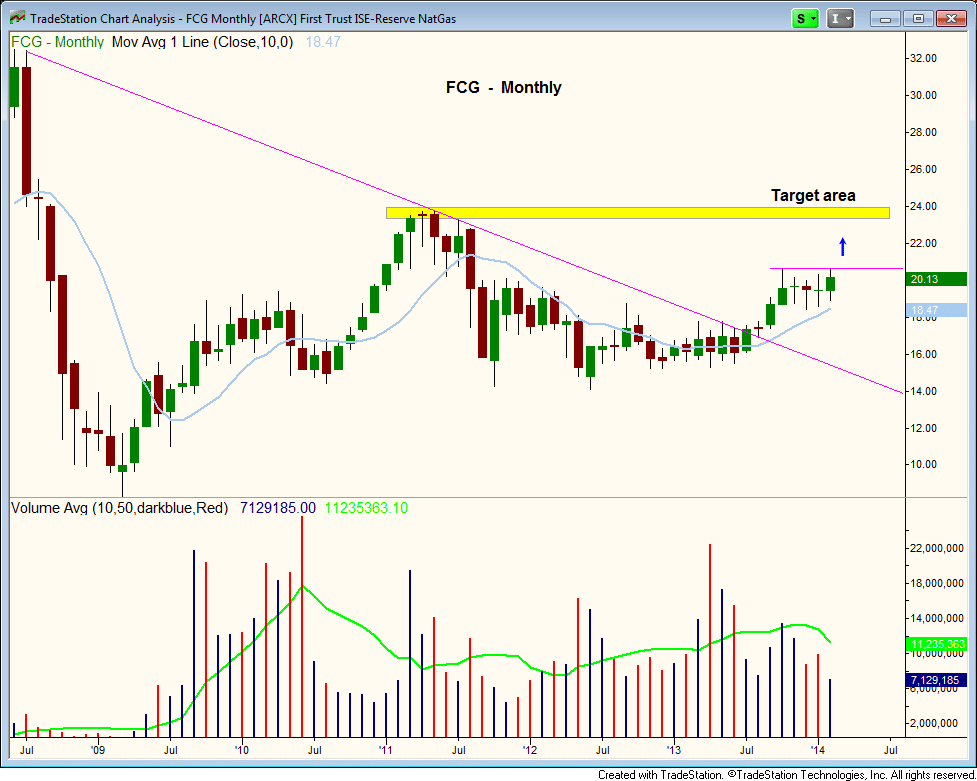
Natural Gas Index ETF ($FCG) continues to form a bullish pattern on the daily chart, finding support off the 10-day MA and closing off the lows of the session on Tuesday. We look for the action to hold above the rising 20-day EMA as it consolidates before breaking out to new 52-week highs.
The target area for $FCG is around $23, which is the prior high of 2011 on the monthly chart below. Note the tight price action the past few months as $FCG held above the rising 10-month moving average:
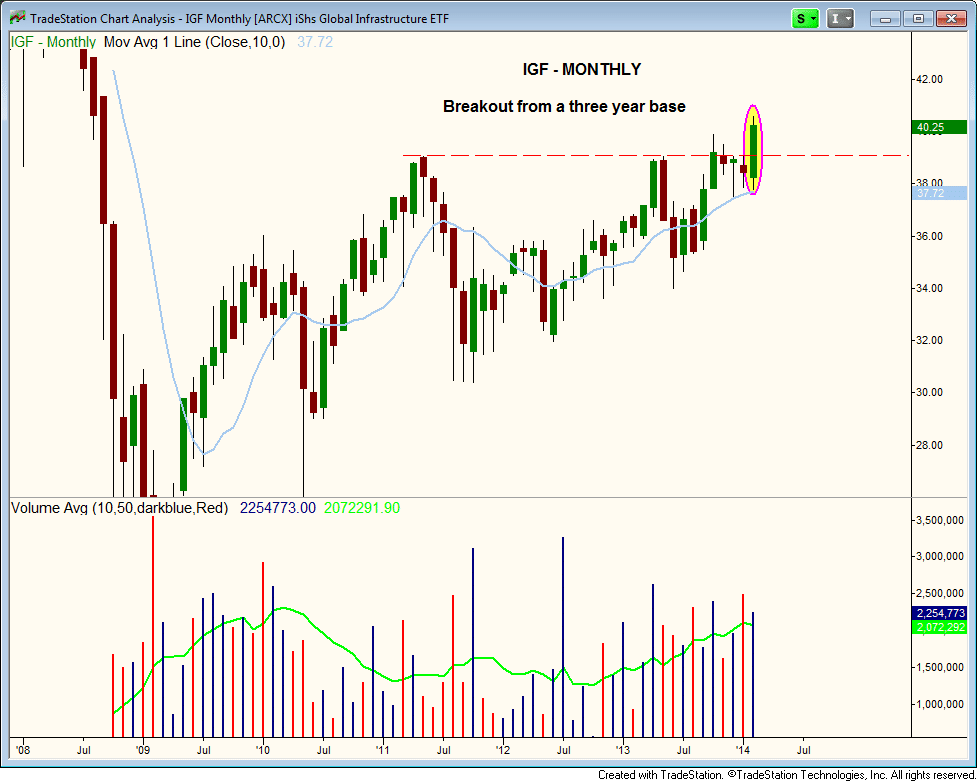
iShares S&P Global Infrastructure Index ($IGF) recently broke out from a three-year long consolidation, after tightening up from November to January, just above the rising 10-month MA.
There are three more days of trading left before the end of the month, so assuming that the action holds up, then $IGF will have a confirmed breakout on the daily, weekly, and monthly charts:
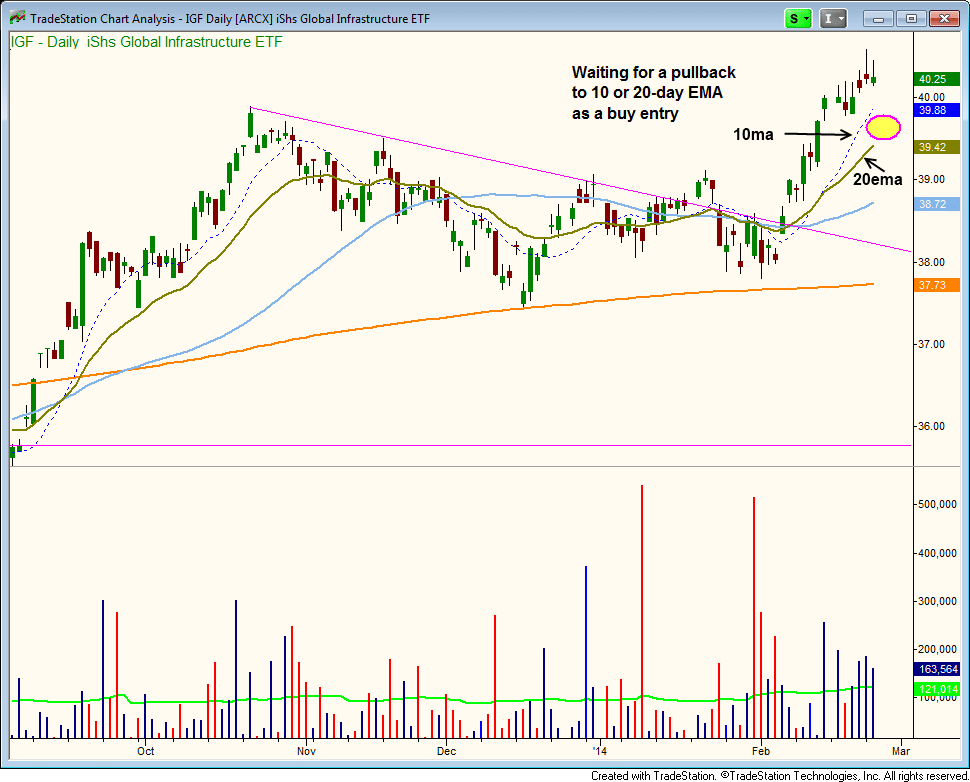
The daily chart of $IGF is extended in the short term, so we must wait for a low risk entry point to develop. A three to five bar pullback to the 10 or 20-day EMA is ideal. At the very least, we'd like the price action to hold above the rising 20-day ME minus a shakeout bar or two:
Our short position in emerging markets triggered on Tuesday with (inverse ETF) $EDZ clearing $46. The price action followed through nicely on a pick up in volume. We'd like to add to the position on short-term weakness.
Deron Wagner is the Founder and Head Trader of both Morpheus Capital LP, a U.S. hedge fund, and MorpheusTrading.com, a trader education firm.
|


 Free Festival of Traders Videos