NASDAQ Commentary
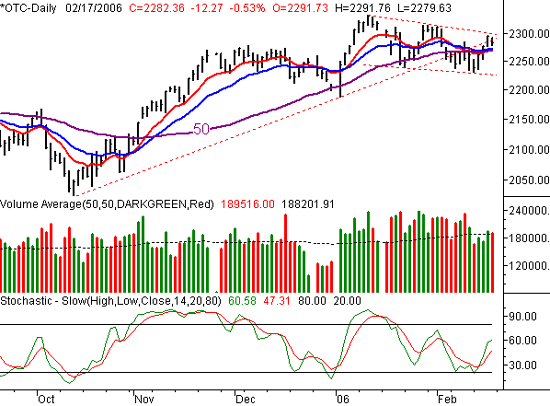
The week ended up being a pretty positive one, thanks to the big rallies on Tuesday, Wednesday, and Thursday. The NASDAQ Composite ended up gaining 20.48 points for the week, for a 0.91% improvement, and ended Friday at 2282.36. That move also left the index above some important short-term averages. Then again, we've seen similar crosses of these lines before, and those didn't amount to anything. In other words, we're not willing to take the bait just yet.
The short-term buy signals here are the crosses back above the 10 and 20 day averages (red and blue, respectively). However, there are two problems with that set of signals. The first problem is that we saw this exact same thing happen twice already this year, with nothing coming of it either time. Maybe this time it will, or maybe not. We still don't know. The second problem involves the set of support and resistance lines that you see plotted all over the chart (red, dashed). The NASDAQ is still under a major one currently at 2300. Plus, despite last week's gains, we still see a basic pattern of lower highs and lower lows.
For that reason, we're not going to by convinced of any bullishness until we see a couple of closes above 2315. That's where we peaked in late January. A close above that level would constitute a 'higher high'. Be cautious until we get some clarity here.
NASDAQ Chart

S&P 500 Commentary
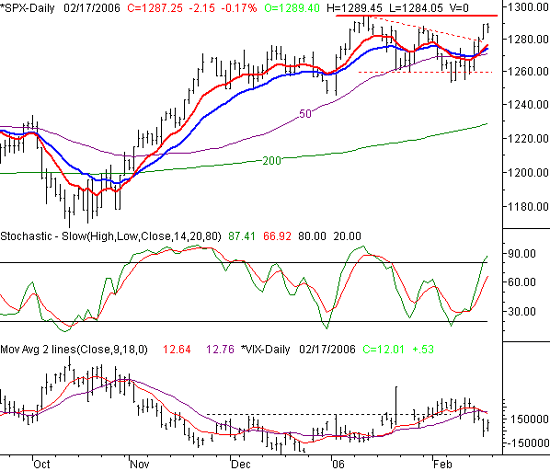
The S&P 500's 1.6% rally last week easily topped the NASDAQ's - an interesting twist that we'll look at closer in the Dow's analysis. The close at 1287.25 for the SPX was 20.25 points higher than the previous week's, and we also saw some important moves above the key short-term averages. But like the NASDAQ, we're still a little suspicious of such a move, as we've seen it before.
Unlike the NASDAQ, the S&P 500 has actually made a higher high by moving above 1287.95, where it traded briefly near the end of last month. Yet, we're still a little hesitant about reading much into that chart. The index is still under the 52-week high of 1294.90, so the biggest of the barriers has not been toppled yet. Already, however, we see two issues for the bulls. First, we're approaching a stochastic overbought situation, which will weigh in on the market. And second, The VIX is back to those unbelievably low levels where stocks start to run into trouble. And if you look closely, both the VIX and the SPX trends faded on Friday, hinting that both were itching to turn the other way.
Besides, last week was an option expiration week, which can wreak a little havoc in both bullish and/or bearish ways. The markets true colors may be exposed this week. Let's give things a little time here to see if the bulls have the conviction to follow through on last week's strength.
S&P 500 Chart

Dow Jones Industrials Average Commentary
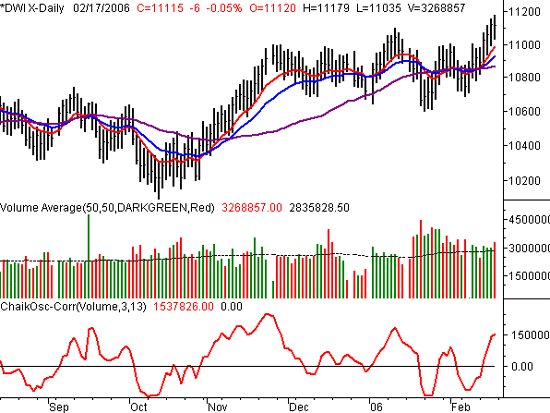
The Dow's 1.8% gain last week topped all the indices, and even doubled the NASDAQ's run. The blue chip index added 196 points last week to close at 11,115, which was the highest close we've seen in years. Plus, Friday's high of 11,179 was a new multi-year intra-day high. So clearly, these stocks are doing something right. Oh yeah, don't forget that Dow's close at 11,115 left it above major resistance lines at 11,000, as well as 11,100.
In a nutshell, that's technically bullish.
The problem is that the NASDAQ is supposed to lead the market in bullish as well as bearish ways. What we have here is a case of investors seeking these blue-chips out instead of the speculative names in the NASDAQ. That's not a sign of general optimism. Yet, we'd still have to concede that these stocks may have the most to offer to 'long only' traders. On the other hand, if things turn really sour, it's not like these stocks will remain bullish.
As described above, it may be worth waiting to see how things take shape this week. If the NASDAQ perks up again, then the Dow may continue to have something to offer. In that case, we'd still like to see a slight pullback to the 10 or 20 day average and then a bounce, just to verify support. If instead the rest of the market falls apart, we don't think the Dow will be too far behind.
Dow Jones Industrials Average Chart

Price Headley is the founder and chief analyst of BigTrends.com.