The markets have been seesawing like a hyperactive three-year-old recently, and this week has been no different. This morning, the markets are seeing some green as inflation data came in pretty benign and energy prices dipped. The markets are finally unwinding and relaxing after the appointment of our new Fed Chief Bernanke.
NASDAQ Commentary
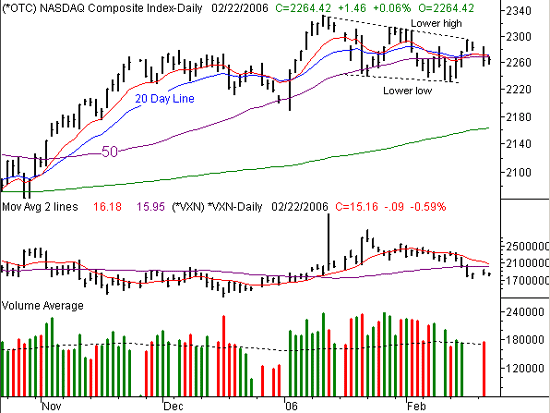
As of right now, the NASDAQ is down 14 points (-0.61%) for the week, and up 10.3 points (+0.46%) for the day. Look at the chart below and you will see that the NASDAQ is continuing to make lower highs as well as lower lows as it chops around in the same channel it's been in for the past 1.5 months. The NASDAQ also is right at both the 20 and 10-day moving averages. This is truly a pivotal point in the market, but we are more bearish than we are bullish on NASDAQ. If we see a close above the 2285 mark, we may be switching to a more bullish stance, but for now, it's more bearish in the short term (1-2 weeks).
NASDAQ Chart

S&P 500 Commentary
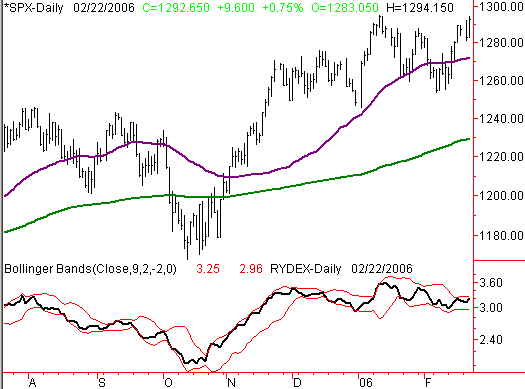
Take a look at the chart below. It highlights previous times where there was a sharp reversal in the Rydex as it bounced off the upper band. During these times, we've also seen bearish divergence between the Rydex fund flow and the SPX. That means that when the SPX was down 1% in a day, we saw the Rydex move much lower than 1% or much lower than it usually does on a 1% move down in the SPX.
This past week, we saw the same thing as in these previous occasions. There was a sharp "v" reversal in the Rydex accompanied by a bearish divergence in the Rydex fund flow. The Rydex fund flow actually made a brief run at bullishness right at the top of the "v", but it turned out to be a strong reversal pattern. So, the Rydex is pointing towards short-term bearishness.
S&P 500 Chart vs. The Rydex

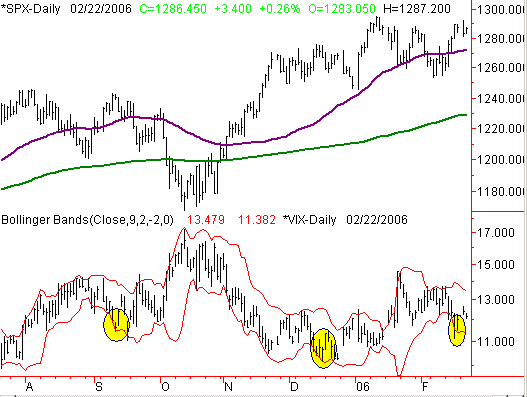
Next, we should take note of the recent action in the VIX. The VIX showed a reversal last week off of the bottom band. First of all, the VIX rarely has a close at the bottom band and almost never has a close below the bottom band. With that in mind, the recent reversal is significant, and we believe we are more likely at a short term top than at a short term bottom (short term means 1-2 weeks in this case). The VIX is confirming the same thing we are seeing in the Rydex above.
S&P 500 Chart vs. The VIX

Dow Jones Industrials Commentary
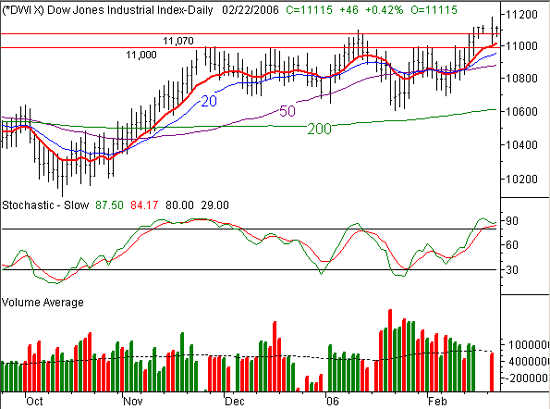
The Dow has crossed well above the critical 11070 market and hit what a appears to be a multi-year high. That may be bullish if the Dow and can hold at this level. However, given the recent Rydex and VIX data, the market's weakness is more likely to continue.
Another interesting note, is that lately stochastics has been great at showing oversold and overbought levels in the DOW, SPX, and COMP. We are currently showing an oversold level for the Dow and that makes us side even further with short-term bearishness despite today's mid-day rally.
As of right now, the Dow is up 77 points for the day, and is up 31 points (.27%) for the week.
Dow Jones Industrials Chart

Bottom Line
The market has an underlying bearishness that is more likely to play out in the next couple of weeks. We don't know for sure, but our indicators are pointing in that direction.
Price Headley is the founder and chief analyst of BigTrends.com.