Several postings back, we looked at an overnight bias that persists across all markets. This strategy showed you an overnight strategy that could be used in 36 futures markets. With a slight added qualifier, we can also turn that strategy into a day trading indicator. That is an in-on-the-open, out-on-the-close indicator, as are most of our signals to date.
Despite my intention of approaching the day trading model in an organized methodical fashion, my market obsessions do get me sidetracked. I keep coming back to cups and caps, because they seem to fit market theory so well. In my version of a cup, both the lowest low and the lowest close of the last three days occurred on the second (or middle) day. For a cap, it's the reverse â€" the highest high and the highest close both occurred on the second day. My eyes get drawn to those bottoms, because they look just like the description.
For a visual diagram, please click here to open a new browser window with a chart.
Obviously, it works fine at the highs and lows where your eyeballs tend to venture. The losers occur in more of the hidden realms â€" those cup/cap-like moves that merely turned out to be insignificant gyrations within mid-level ranges. Again, this is all a big numbers game, and if our overall hopper tips sufficiently in our favor, we'll consider using the methodology.
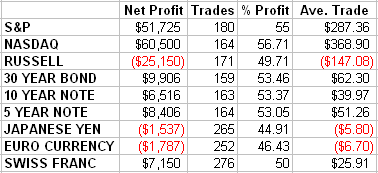
Figure 2 shows buying (selling for shorts) on the opening and selling (buying for shorts) on the close following a cup (cap for shorts) as previously defined. The one added qualifier is that the low of the cup (high of the cap) must be lower (higher) than the previous three days.

Art Collins is the author of Market Beaters, a collection of interviews with renowned mechanical traders. He is currently working on a second volume. E-mail Art at artcollins@ameritech.net.