NASDAQ Commentary
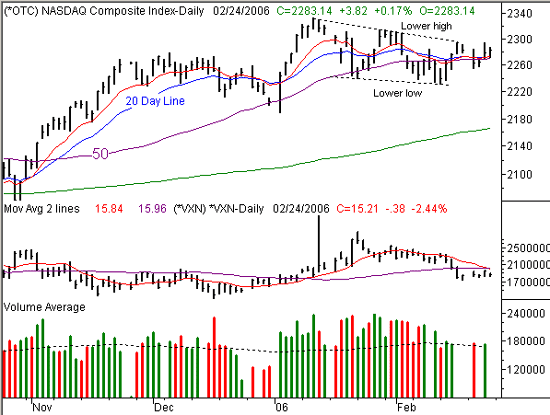
The week ended with the Nasdaq in positive territory up 6 points since last week. Friday summed up the week with it's choppiness and the NASDAQ's failure to hold on to any significant gains. Most of the week consisted of sideways trading. The NASDAQ did make it above the 10, 20, and 50 day lines which was somewhat bullish.
The NASDAQ never did make it over the 2315 mark, which as you can see in the chart below was a previous high that was at the top of this bearish channel in place in the NASDAQ. At this point, the NASDAQ is bearish because of this down trend and at the current level it is meeting an area of resistance. What we'd like to see is a close above 2315 so that the sentiment can turn more bullish.
NASDAQ Chart

S&P 500 Commentary
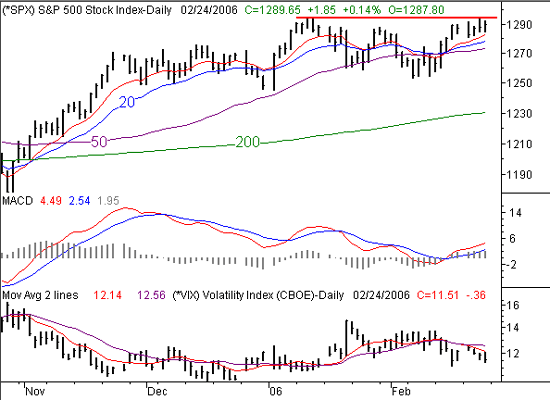
The SPX managed to muster out a small gain for the week closing at 1289, up 2 points for the week, a change of less than 1 percent. The SPX is currently teeter- tottering at a multi- year high and also sits atop a pivotal point of resistance that has formed in the last 2 months. Ideally, the bulls would like to see a weekly close above the 1294 level. This level was reached this week and was also touched on January 11th.
On the bullish side, the SPX managed to stay above the 10, 20, and 50-day moving averages this week. At the same time, we saw a MACD cross that was bullish about a week and half ago. This cross has proven to be bullish. On a bearish note, both the Rydex and the VIX are currently bearish. They've been good market sentiment indicators recently. So, the bottom line, is that we are siding with bearishness in the SPX. However, the SPX is looking stronger than the NASDAQ recently and we may see the SPX lead a bullish reversal.
S&P 500 Chart

Dow Jones Industrials Average Commentary
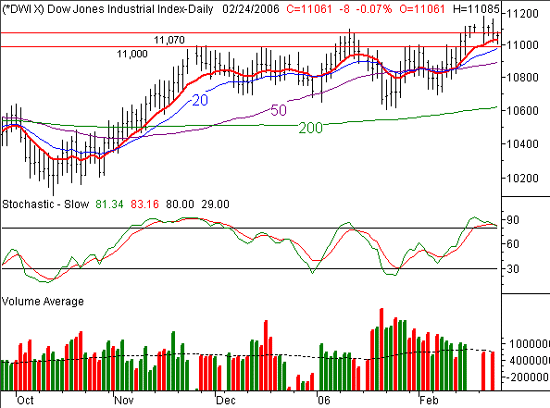
The Dow was the only major index to be down this week, showing a 54 point loss to close at 11061, a loss of less than one percent. The Dow dropped under the 11,070 level and has begun to diverge negatively with both other indices. There are still significant oversold conditions in the Dow, and we would not be surprised to see a dip this coming week. However, the Dow may be the best bet if the market drops significantly this week as speculative money moves into the bigger names in the Dow. The bottom line is that we are bearish on the Dow. However, we are willing to bet that the Dow will behave better if the market takes a significant dip this week. If we see a bullish surge this week, the Dow will likely be the laggard on this group of three indices.
Dow Jones Industrials Average Chart

Price Headley is the founder and chief analyst of BigTrends.com.