NASDAQ Commentary
The NASDAQ is up 0.72% today, but the bulls shouldn't get too excited about that. After yesterday's whack, a bounce was likely. We still haven't made a higher high yet, so we're not all that impressed. On the other hand, that's hardly a bearish call. The 10 day line held up as support, and may have even been the springboard for today's strength.
Today's low of 2285.64 pretty much matched the 10 day average, at 2284.93. And yesterday's low of 2276.74 was just a hair above the 50 day line, at 2271.29. So, the composite is finding bullish support in the places it's supposed to be finding it. The problem is, it can't do anything with it. Yet again, we say resistance at 2313 when we reached that mark on Monday. That was the same problem area we hit in late January, so until we can clear that hurdle, we're not worried about any missed bullish opportunities.
In fact, even that may not be enough to justify a bullish stance. There's still the issue of resistance at 2332.92, where the NASDAQ toped out in early January. The difference between there and the closer resistance at 2313 is is only 19 points. While that may be enough potential for a leveraged trade, it's really not worth the risk for a 'bigger' picture stance. We really need to see a couple of closes above 2333 before the bulls get confident.
On the flipside, only a move under the 50 day line at 2272 would get us thinking like bears, and even that may not be enough. We fell under the 50 day average briefly in January, and for a few days in February, but that didn't amount to much; stocks just moved back above that line, again going no farther than that. The more important floor here is the support around 2235. That's where we saw February's bottom, and only a move under that level would represent a true breakdown.
In the meantime, traders are content to see the NASDAQ remain range-bound.
NASDAQ Chart

S&P 500 Commentary
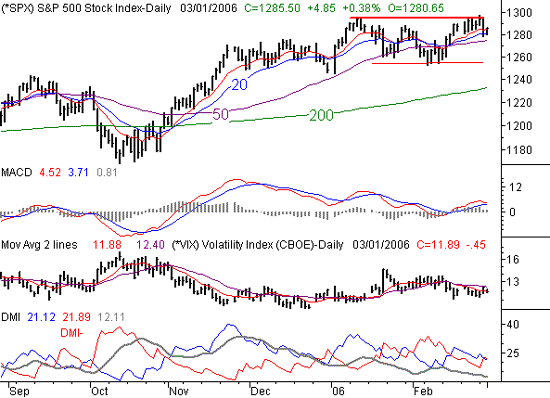
The S&P 500's 0.38% gain today isn't anything to write home about either; the large-cap index is still in the hole by 0.31% for the week so far. The SPX chart has a lot of the same issues as the NASDAQ's does, in both bullish and bearish ways.
Like the NASDAQ, the S&P 500 found support at one of its key short-term averages - the 20 day line, at 1280.28. It was only under it briefly yesterday, and the index pushed off of it today on the way to the current reading of 1285.50. That leaves the S&P 500 back above the 10 day average as well. All in all, that's on the bullish side of things.
The problem is the resistance that lies above. On Monday when the SPX hit a new multi-year high of 1297.55, it prompted a few traders to start thinking about buying into strength, now that we had a bullish catalyst. So far, Monday's venture into uncharted waters has been anything but bullish. What makes this resistance twice as strong is the fact that we pretty much topped out here in mid-January. Throw in the fact that 1300 is a big round number that is going to act as a psychological barrier, and you have a lot of barriers for the bulls right now. From here, we'd say wait for a couple of closes above 1300 before getting bullish, as the market has just been too choppy and reversal-prone to trust lately.
And like the NASDAQ, there's also a floor for the SPX. It's at 1255, where we bottomed in February. Until we break out of that box in either direction, we have to assume this chart will remain range-bound.
S&P 500 Chart

Dow Jones Industrials Commentary
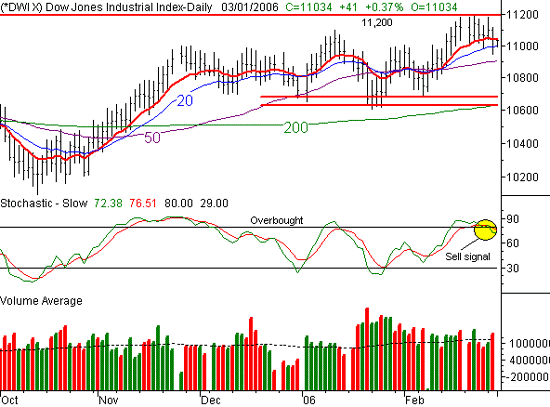
Leave it to the Dow to be an oddball. It's the only index that actually moved to new highs in February. But even the Dow has turned lethargic in the last few days, mostly due to an overbought situation.
For the day, the industrial average is up 0.37%, yet it's down 0.25% for the week. The current reading of 11,034 is well under the recent peak of 11,199, but it still leaves the blue-chip index above that pesky 11,000 level.
The story is the same though - the Dow has been so range-bound an inconsistent that even the move to new highs is suspect. As you can see on the bottom of our chart, not only was the Dow stochastically overbought, but we actually have a stochastic sell signal now (both lines are back under 80). Plus, the Dow appears to be hitting resistance at its 10 day line today. That's not exactly a positive omen.
The key levels to watch here are 12,000, 10,677, and 10,630. That 12,000 level would mark a new 52-week high for the Dow, and it's also one of those afore-mentioned big, round numbers that seems to incite tension for traders. The other two levels (10,677 and 10,630) are recent support lines, the lower of which also lies where the 200 day line is currently parked. Like the other indices, only a break outside that zone would mean much to us.
Dow Jones Industrials Chart

Price Headley is the founder and chief analyst of BigTrends.com.