Good morning! The market continued to hold its daily congestion on Thursday, starting with a decent gap lower into the open. The main difference from the the rest of the week was that there was a great deal of back and forth action throughout the session, as opposed to Monday-Wednesday where the market saw a strong morning move followed by more choppy range action in the afternoon. By the end of the session the Dow Jones Industrial Average was down 28.02 points at 11,025.51, the Nasdaq Comp. Index fell 3.53 points to 2,311.11, and the S&P 500 Index lose 2.10 points to close at 1,289.14. The ratio of advancers versus decliners was not as extreme as earlier in the week either. On the NYSE decliners beat out advancers by 9 to 7, while on the Nasdaq they led 17 to 12.

The S&P 500 and Dow saw the most weakness out of the open, falling into the lows of the prior day in the S&P 500 and Tuesday's lows in the Dow. Both continued to decline out of the open until 10:00 ET. The Nasdaq held up a lot better with its 5 minute 200 sma serving as support. The majority of these larger gaps in the indices will fill during the morning of the gap unless it is an initial reversal off significant daily support or resistance. Since the market has been in a longer range now, the market had an easier time doing so. A Phoenix created as the Nasdaq hugged its 5 minute 20 sma resistance and 5 minute triangles in the S&P 500 and Dow all broke higher with the 10:45 ET reversal period.
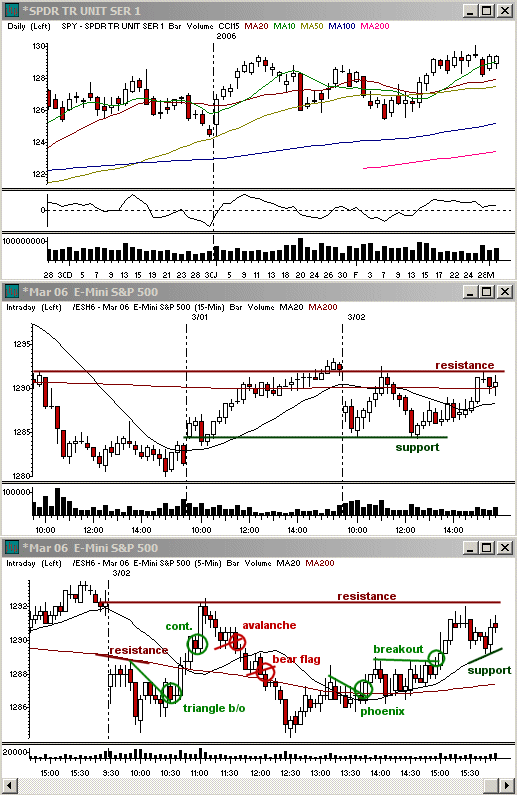
The follow through on the mid-morning rally was very strong. The gap was quickly closed in both the S&P 500 and Dow and the NASDAQ made it back into the range at highs from the 27th before stalling. With all three indices hitting resistance at once, it held well. The Dow even had 15 minute resistance at its 20 sma with 5 minute resistance at the 200 sma as the gap closed. With the extreme upside move on this rally, it made a range more probable into the afternoon on the 15 minute charts unless the market could base along the highs with only a very slight decline in price over noon. Since that did not happen, it led to the wider intraday range that would persist into the close.
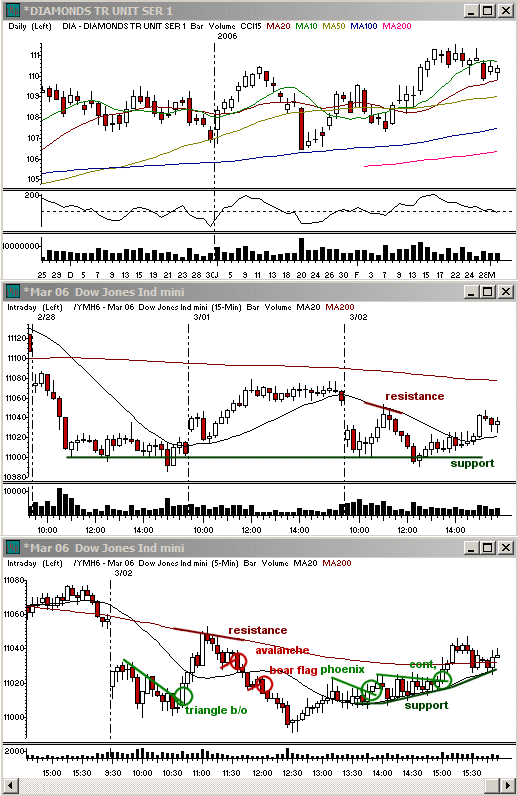
Prior lows in the S&P 500 and Dow and the 5 minute 200 sma in the Nasdaq all held very well into the 12:30 ET reversal period. After three waves of selling on the 2 and 5 minute charts off the morning highs, the indices pivoted strongly off the price support and began to climb into the afternoon. The action became more choppy, however, despite the trend. The Nasdaq had the strongest upside initially, but corrected the most off resistance when the 14:00 ET reversal period hit. All three indices then resumed their buying into the close. The S&P 500 and Dow both made it back into the zone of morning highs, while the Nasdaq also pulled into the upper half of the day's range.
Heading into the weekend the market is pretty mixed. The S&P 500 and Dow both look lower. With stronger downside pace in the market within the range over the past two weeks, it's going to be more difficult for the market to break strongly higher. The Nasdaq has a little more going for it by way of the bulls because it's basing more cleanly at the highs of the recent range, but as a whole there is room for the indices to break either way since a strong intraday bias on the 30-60 minute charts for a range break is still lacking.
Economic Reports and Events
Mar 03: Mich. Sentiment-Rev. for Feb (9:50 am), ISM Services for Feb (10:00 am)
Earnings Announcements of Interest
Only stocks with an average daily volume of 500K+ are listed. List may not be complete so be sure to always check your stock's earnings date before holding a position overnight. (A) = Earnings after the close, (B) = Earnings before the open, (?) = Earnings time not specified at the time of this writing
Mar 03: BVN (?)
Mar 06: ABP (B), CMGI (A), RIO (A), GG (B), KFX (A), LEXR (A), MYOG (A), SMTC (A)
Mar 07: ABS (?), SIL (?), MATK (A), NR /?), NRG (?), OSIP (A), PSTI (B), SRZ (?), COO (A), KR (?), URI (B)
Note: All economic numbers and earnings reports are in lines with those compiled by Yahoo Finance. Occasionally changes will occur that are made after the posting of this column.
Toni Hansen is President and Co-founder of the Bastiat Group, Inc., and runs the popular Trading From Main Street. She can be reached at Toni@tradingfrommainstreet.com.


 Free Festival of Traders Videos