NASDAQ Commentary
The NASDAQ's close at 2302.60 on Friday was a 15.56 improvement over the prior week's close. Plus, the week's 0.68% gain was enough to keep the composite above the 10 day line for the week, and generally making higher trading ranges. It wasn't gang-busters, but technically, it was a positive for stocks. However, the gains are so tepid and uninspiring, we have to wonder if it's a sign of weakness that just hasn't yet materialized.
The discussion we had in the MidWeek Update still pretty much applies here. Until we can get and stay above the recent peak of 2332.92, then last week's gains don't exactly inspire a lot of bullishness. We're only about 30 points from there now, so a couple of days could get it done. We just don't have much faith in stocks, as they've been so up-and-down all year long.
On the other hand, the 10 day average is finally starting to act as support....something that wasn't happening just a few weeks ago.
So once again, we see that the composite is stuck in a range. The trend is slightly bullish, but the range has been stronger than any trend thus far. Remain patient here - we still feel a big move coming one way or the other.
NASDAQ Chart

S&P 500 Commentary
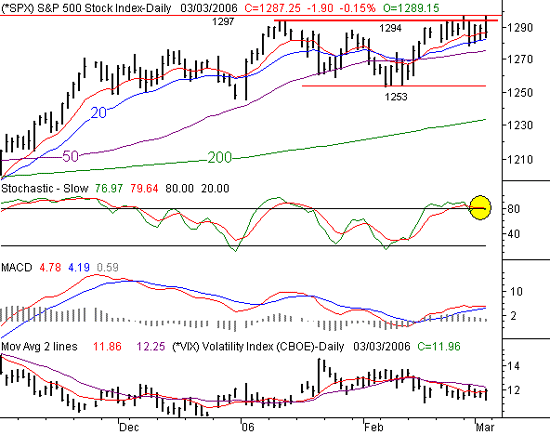
The S&P 500's 2.2 point loss last week left it at 1287.25. However, on both Monday and Friday, we managed to trade above the previous high of 1294.90. The new line in the sand is around 1297.45. The 10 and 20 day lines sort of held as support last week, although it wasn't terribly impressive. In fact, the momentum looks like it's on the verge of tipping on the side of the bears. All in all, it was a mixed bag of bullish and bearish qualities.
Talk about mixed messages! The NASDAQ's gain last week was at odds with the S&P's loss, yet the S&P 500 actually hit new highs. However, as we mentioned above, this chart is turning bearish, at least in the short run. It's almost as if the sellers were waiting until we hit this new high to start taking profits (which isn't unusual).
What's bearish? As of Friday, we have a stochastic sell signal, with both lines falling under that 80 'overbought' level. The MACD lines are technically still bullish, but they're pointed to a bearish crossover soon too. And, again we see the VIX at alarmingly low levels - the same levels that tend to be seen when the bulls are done buying for a while. All in all, it's just not a very encouraging picture.
However, the 20 day average (blue) was support all last week. So, the same range that has boxed the NASDAQ in is also boxing in the SPX chart. As with the NASDAQ, we still need to wait and see who's going to win this war, which is likely to end soon.
S&P 500 Chart

Dow Jones Industrials Commentary
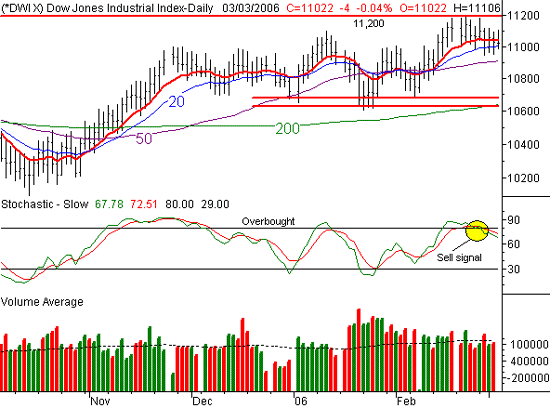
The Dow was the biggest lower of the week, giving up 0.36% to close at 11,022 on Friday. That 40 point dip left this index under the 10 day line, but hovering above the 20 day average. So, we're partially in limbo here, especially seeing how the Dow went from being the leader to the laggard in one week's time. Philosophically, it raises a few questions.
In the meantime, note that we're now several days into a stochastic sell signal on the Dow. Plus, the 10 day line provided no support at all, while the 20 day line wasn't very good support.
But didn't the Dow hit new 52-week highs just a couple of weeks ago? Yep, but as we've been seeing too much lately, new highs mean very little right now.
The philosophical issue is a 'bigger picture' one. How did the Dow get so weak so quickly, while the NASDAQ actually cranked out a gain? In many ways that's bullish, as the NASDAQ tends to lead both up and down movement. The problem is that the NASDAQ didn't actually lead....it diverged. For any bullish movement to be legitimate, we really want to see all the indices participate at least to some degree.
That's not to say that they have to be perfectly correlated, which is why these three charts aren't exactly full-blown bearish right now. We're just saying it's unusual to see the Dow hit new highs two weeks ago, while the S&P 500 did one week ago, and while the NASDAQ hasn't yet. We're going to be very interested in how all this plays out this week. Stay tuned, and be sure to read the MidWeek Update for any new shifts in this dynamic.
And between now and then, keep in mind that resistance is still at 11,200, while support is at 11,000.
Dow Jones Industrials Chart

Price Headley is the founder and chief analyst of BigTrends.com.