Could the three year stint with a weak dollar finally be coming to a close? Maybe. It's not happened yet, and there's no certainty that it will, but the recent chart of the Euro/U.S. dollar has at least the first half of major trend-shift pattern. We don't want to jump the gun, but we do want to put this on our radar so we're not caught off guard if and when it happens.
First let me stress....I'm not predicting anything, since the whole point of using technical analysis is to act on quantitative measures instead of qualitative measures. That allows us to avoid guessing.....and the bias of hope. And so far, we don't have the complete technical signal that the dollar is on the mend. We just want to point out that we're on the verge of a major break in the dollar's resistance. Let's illustrate this with a chart.
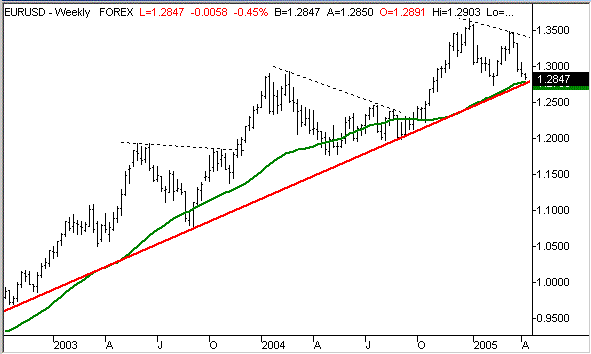
It's actually a rising chart, so you may be wondering how that can indicate the dollar's weakness. Keep in mind that this is the euro/dollar conversion rate, and NOT the dollar/euro conversion rate. The chart is rising because, over the last three years, the euro has been getting stronger relative to the dollar (the same is true for almost all currencies when compared to the dollar).
As you may have expected, this chart's technical trend has clearly portrayed the strength of the move. There is an important technical support line (red) for the euro that extends all the way back to October of 2002. That date, by the way also marks the beginning of the ultimate recovery for the NASDAQ. The S&P 500's bottom came a few months later. Maybe it's not a coincidence? In any case, the euro has been moving higher since then, finding support at that line several times along the way. The green line is the 200 day line, and while the euro/dollar rate has slipped under it on occasion, it has never ventured too far under that moving average. But as you can see, the dollar has reversed its uptrend and moved sharply lower over the last four weeks. And we can now see the euro/dollar conversion rate at right above that support line as well as the 200 day line. Monday's closing rate was 1.2849. Like we said above, it hasn't happened yet, but it's close enough to merit watching this week and next week.
WEEKLY EUR/USD

So what's the point? Haven't we seen this happen before? Yes indeed. In fact, we've seen two clear instances of this same scenario prior to this one. See the dashed lines above? These mark the only times that the euro/dollar rate has made a lower significant high (a high that was lower than the previous peak) within the confines of the natural ebb and flow of things. Take special note of how the support line (red) and the 200 day line (green) didn't allow this chart to make a lower low after making a lower high.
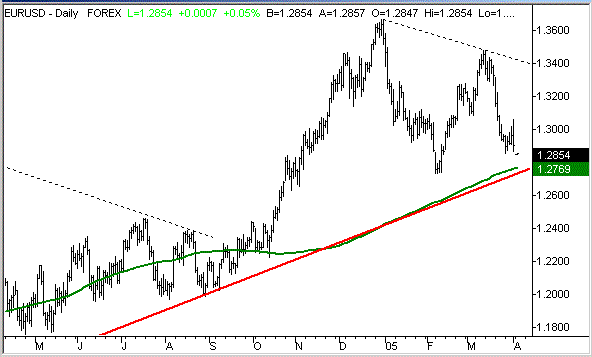
Then why mention it at all? Because this time really has the underlying potential to be different. We can already see the first part of an important reversal pattern - the lower high (as indicated by the dashed line). What we need to see next is a lower low. The most recent low from February was 1.2876, so we need to eclipse that in order to better cement this reversal into place. But the reason this particular pullback could be different - and actually fall under support - is that the key factor in what makes the dollar weak is radically different now than it was in 2003 and 2004.
During that time, interest rates were at rock-bottom lows, and even when the Fed started to raise them early last year, they were still at rock-bottom lows. So what's that got to do with the dollar? The value of the dollar, as with all things, is based on supply and demand. And as long as the U.S. inflation rate was greater than the interest rate you could receive on dollar-denominated assets (treasury bonds and T-bills), having anything dollar-based was a liability because you were probably losing money.
But guess what - that's not quite the case anymore. You know that 'measured pace' of rate hikes Dr. Greenspan has been talking about since March of 2004? The Fed funds rate went from 1.0% to the current rate of 2.7% in a hurry. And while 2.7% is still low by historical standards, it's much higher than anything we've seen in a while. So how high are they? There is legitimate talk that the rate hikes are near an end, at least for now.
The reason the Fed may be able to back off on the rising rates is simple - it's now finally starting to make an impact. The goal of higher interest rates is to stifle inflation by making it a little harder to borrow and spend (reduces the demand). And with the exception of oil/gas, inflation actually has been contained. Oh, there's still inflation for sure. But the inflation isn't painfully higher than the rate of return you can now get on bonds, CDs, and T-bills. In other words, the open market isn't shunning dollar-based assets.....at least not quite as much as they were (the demand is growing again). There's still a little more work to do, and we wouldn't be surprised to see the Fed funds rate creep up to 3% or better this year. But even at 2.7%, we can already see some real growing interest in the dollar that just wouldn't have existed a year or more ago.
But like we said, it's only a possibility at this point. So until this chart actually breaks down, we can't assume anything. For your convenience, we'll zoom in on the chart below to a daily timeframe.
DAILY EUR/USD

Price Headley is the founder and chief analyst of BigTrends.com.