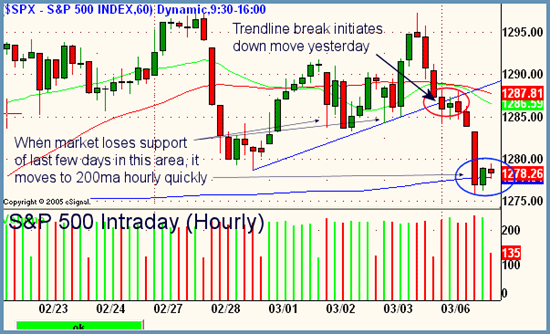
Good Morning, Traders. Bearish day on the street yesterday with a lot of mixed signals early on which could have prefaced the market moving either one way or the other. Tons of divergence all over the place intraday which eventually ended in all market internals pointing south in the early afternoon, sparking a selloff that pushed the Dow down by 63 (10958.59), the S&P by 9 (1278.26), and the Nasdaq Composite about 16 and a half (2286.03). All sectors were off on the core list with energy and metals getting hit the hardest. Breadth was negative on both markets, as were advance decline lines at the close.
In the snapshot above, notice how the recent support of the last two days in the S&P intraday got breached today to the downside. This is interesting when taken in the context of the fact that the past two weeks of trading have opened and closed in the same place as we were discussing in yesterday's Big Picture. Does this mean that the volatility contraction is resolving itself to the downside? There is still too much near term support below us to tell just yet. One clue may be the 200 period moving average on the hourlies which is the blue line annotated above. Note that when support was broken around midday yesterday, the S&P quickly deflated down to the 200ma hourly as its next support level. This area will be key to watch over the next few trading days. 200 period moving averages on any timeframe often act as magnets for prices and can hold them there for protracted periods of time. If the 200ma gets resolved to the downside, it would have bearish implications going forward because we have been riding comfortably above it since February 15th of this year. Keep that in mind. If we break and move lower we essentially negate almost 3 weeks of building here and also make a mockery of the fact that new 2006 highs in the S&P were recently set. We expect some consolidation here between 1275 and 1280 roughly in the S&P and then a resolvement. If its up, then we have clearance to about 1290 and to the downside we won't find any support until 1260. It is of interest to note as well that the 50ma daily (not shown) is currently riding right at 1275 as well. So we have two major moving averages on two important timeframes holding us up here at this juncture. All the move bearish if we break. Near term bias is now sideways with the overall still to the upside. Keep your picks to the strongest names in the strong sectors that are showing relative strength to the market on down days.
Peter Reznicek is Chief Equity Strategist for ShadowTrader.net a subsidiary of thinkorswim, and a Principal of the Prana Fund, a hedge fund. Mr. Reznicek can be reached at preznicek@shadowtrader.net.