Once a trendline is established by the third valid point, and the trend continues in the original direction, the trendline becomes a tool with many uses. There are two basic concepts of a trend:
1. A trend in motion tend to remain in motion
2. Once a trendline determines the slope or rate of speed of a trend, the trend usually maintains that slope
The trendline can be used by the Day trader or Options trader to determine the extreme in corrective phases or when a trend is changing.
In an uptrend, a trader√Ę‚,¨‚"Ęs intent is to buy in the dips. So an up trendline can serve as a support boundary which can be used as a buying area indication. When the corrective dip comes close to or touches the trendline, it√Ę‚,¨‚"Ęs time to buy.
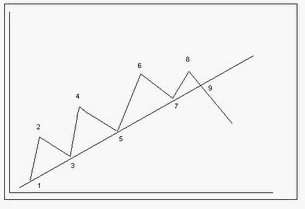
Once a trendline is violated, it can no longer be used to determine buying and selling areas. Most likely, the breaking of a trendline is a warning the trend is changing and calls for a liquidation of all positions in the direction of the previous trend. Note in the drawing below of an uptrend, dips located at points 5 and 7 would be excellent opportunities to buy additional long positions. However, at point 9 when the trendline is severely broken, it is time to liquidate your long positions.

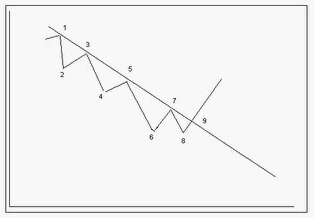
The opposite is depicted in the drawing below of a downtrend. A trader participating in Swing Trading would see points 5 and 7 as excellent indicators to sell. Then when the trendline is broken at point 9, it is evident of an upside trend reversal.

How do we determine the significance of a trendline? This is a twofold answer. First of all, the longer the trendline has been intact the greater the significance. For example, a trendline which has been intact for 3 months is much more significant than one intact for 3 weeks or even 3 days. Secondly, significance is also measured by the number of times the trendline has been tested. Looking at a trendline that has been touched 8 times would create more confidence than one that has been touched only 3 times. The more significant the trendline, the more confidence it inspires and the more impact its penetration has on a trader√Ę‚,¨‚"Ęs decision to liquidate his positions in Swing trading, Day trading or Options trading.
Andy Swan is co-founder and head trader for DaytradeTeam.com. To get all of Andy's day trading, swing trading, and options trading alerts in real time, subscribe to a one-week, all-inclusive trial membership to DaytradeTeam by clicking here.