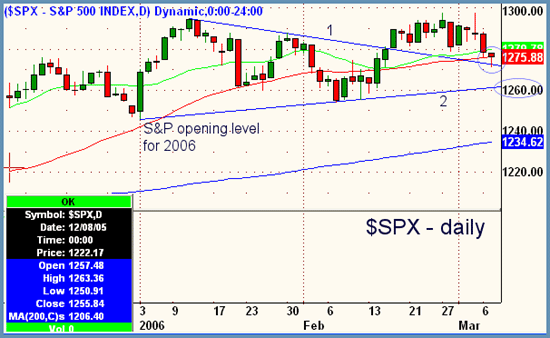
Good Morning, Traders. When is it going to stop? And, more importantly, where will it stop. Selling has been continuous as of late and many investors are probably asking themselves these same questions. Lets look at a daily S&P chart together to see if we can get a handle on it. Notice in the daily snapshot above that there are two trenlines drawn in blue. Trendline 1 is the downtrend of 2006 over the tops of price action that was broken on February 16th. Notice how the selling of the last few days has stopped right at what we call the "backside" of this trendline. A general rule of technical analysis is that when a trendline is broken to the upside, its opposing or backside will often act as support when prices come back down to that area. That is exactly what happened yesterday (upper circled area) as the third day of selling in the markets was stopped late day by this trendline (1). The 20 (green) and 50 (red) period daily moving averages are also here at this juncture but so far neither is making that much of an impact on prices as both have been breached in the last two days. As you can see in our picture above, yesterdays close was right at the 50ma daily (red). If the market does not hold here today, the odds are pretty strong that we move down to the lower circled area and the supporting trendline (2). So the market is really in a make or break situation at this juncture. We either hold this backside of trendline (and 50ma daily support), or we drop down to the next major area of support which will be at the aforementioned 1260. This then will be even more important that it hold because if you look to the left of the lower circled area, you will see that this is getting dangerously close to where we opened for the year on this benchmark index, and if we start pushing below here, then the markets are down for the year which will have negative psychological impact on all players involved. Near-term bias is sideways to down, with the Big Picture overall still bullish. Be careful out there, things are weakening. A confirmed close at this point below where the S&P opened for the year would change our overall bias to bearish since we have come close to testing this area earlier in the year.
Peter Reznicek is Chief Equity Strategist for ShadowTrader.net a subsidiary of thinkorswim, and a Principal of the Prana Fund, a hedge fund. Mr. Reznicek can be reached at preznicek@shadowtrader.net.