NASDAQ Commentary
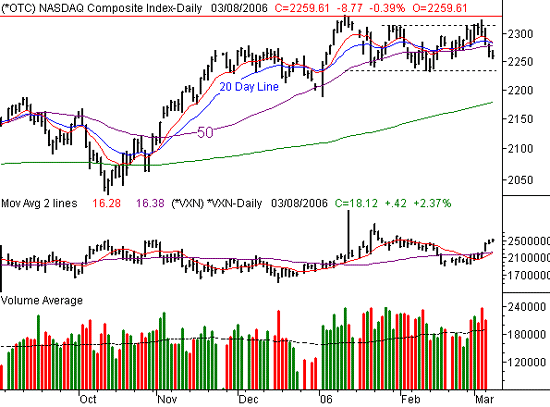
Although the NASDAQ managed to get into the black for a few minutes this morning, it's been a struggle to stay there. In fact, as of right now, the composite is underwater again. Currently down 8.77 points (-0.39%), the index is on track toward its fourth straight losing day. Under normal circumstances we'd really be waving the bearish banner, but in this case, we're still not taking the bait. The momentum may be with the sellers, but we've seen this move too many times before over the last few weeks to really believe this pullback has any more meaning than the last few. Let's take a look at the current chart, as we highlight what it will really take to convince us that stocks are about to make a correction.
OK, the current reading of 2259.61 is under the 10, 20, and 50 day lines. We fell under all three of those moving averages yesterday, but a second - and lower - close today under those same averages will complete a two-part sell signal. Yesterday's close was at 2268.38, so be sure to check in once today's closing bell rings.
On the other hand, even that second lower close may not be enough to really inspire the bears, or frighten the bulls. We saw similar charts in January and February, and neither of those moves ever really went anywhere. Instead, the NASDAQ rebounded once it got near 2240. That's our line in the sand this time around. A move under that level would be enough technical damage to keep the bulls away for a while. Anything over that line, and we'd have to assume that the bulls are still interested in buying on any dip......like this one.
In the meantime, mark resistance at 2280. That's basically where the 10, 20, and 50 day averages are intersecting, and it should be a rather tough barrier to get past, if the buyers decide to even make the effort. In fact, we'd probably not be interested in going long unless we saw a close or two above 2330. That would be new 52-week highs.
On a side note, take a look at the CBOE Volatility Index (VXN) in the middle of the chart. You may recall how disgusted we were that the VXN was hovering at alarmingly low levels, while the market was largely ignoring that bearish concern. Well, things are changing in that light. The VXN has been working its way higher over the last two weeks, and acting as if it's changing its course. That uptrend for the VXN is bearish for stocks, which is why our slant is a little bit on the bearish side despite the fact that the NASDAQ's support has yet to be broken. The question is, will this move higher for the VXN actually materialize? The last two didn't (October of last year, and January of this year), so we don't want to raise the red flag just yet. We do think it's a little suspicious though.
NASDAQ Chart

S&P 500 Commentary
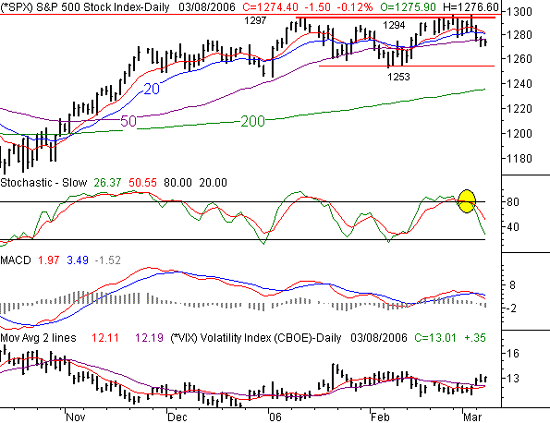
The story here is about the same as the NASDAQ's. The last three days were pretty ugly, and today isn't looking much better. As of right now, the S&P 500 is down 1.5 points, and trading at 1274.40. That's under the 50 day line, as was yesterday's close of 1275.90, so clearly the tone is far less than bullish. As for the 10 and 20 day lines, they were breached on Monday, just one trading day after we saw that important stochastic sell signal. Oh by the way, we've got a MACD sell signal in place now as well.
The point? All in all, this chart looks technically bearish. Period. But as with the NASDAQ, we're just having a hard time getting all that bearish along with the chart. We've seen these dips before, and they didn't work out as expected. So, we're now a little more skeptical. The make-or-break point is the support line at 1253. That's where the SPX bottomed in early February, and it's a fraction under January's low. As for resistance, the combined 10 and 20 day lines were, and still are, the important lines to watch, but the 50 day line became a lot more important this week too. They're at 1281 and 1276, respectively.
We also want to point out that the CBOE S&P 500 Volatility Index (VIX) is trending higher here. As with the NASDAQ's VXN, that's a bearish scenario, but we're still waiting to see if the VIX can actually break free of its range (roughly between 10 and 14). A move above that box would tip the market even further to the bearish side of things.
S&P 500 Chart

Dow Jones Industrials Commentary
We'll be brief with the Dow's analysis. After reaching new highs at 11,199 a couple of weeks ago, the blue-chips have been struggling. The result was a slow slide under the 10 and 20 day lines, which complimented the stochastic sell signal from last week. And as of yesterday, the 20 day line at 10,994 is acting as a resistance level.
However, the Dow's relative strength has also managed to keep it above its 50 day line, at 10,917. Our recent commentary has alluded to the idea that - if the market really turns weak - then the Dow may be the least weak of the three major indices. After all, these thirty stocks are about as safe as stocks can be, if you're looking to stay fully invested at all times. But even that relative strength doesn't guarantee a positive return. That just means that the Dow Industrials are going to not get hit quite as hard, in the event of a market correction.
Well, that may be a glimpse of what we're seeing now. The Dow is down only half as much as the S&P 500 is for the week, and only lower by about a fourth of what the NASDAQ is since Friday.
The only thing to add here is that the Dow has a likely landing point around 10,640. Besides the 200 day line being there, that's also this year's low.
The Dow is currently at 10,970, down 11 points for the day.
Dow Jones Industrials Chart

Price Headley is the founder and chief analyst of BigTrends.com.