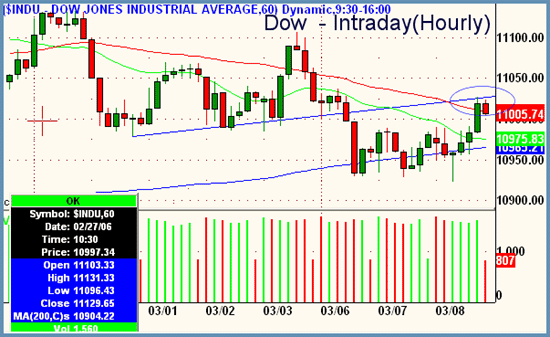
Good Morning, Traders. In yesterday's commentary we discussed trendlines and frontsides and backsides and what happens when trendlines are broken to one side, then become support or resistance in the direction of the move when tested from the other side. The same situation is now playing itself out in the Dow. In the picture above, notice the trendline drawn in blue across the middle of the chart. Its the breach of this hourly trendline in the Dow on March 6th that took the index down to the 200ma (lower blue line), where it proceeded to chop around for about 2 full days. This point has also been discussed in The Big Picture, that being that 200ma's on all time frames (especially on hourlies or larger) tend to act as magnets and hold prices around their levels for some time. Yesterday's late day strength has only pushed the Dow back to the "backside" of the trendline. Expect this area to resist early today. We would not be surprised to see the Dow get a little bit stuck at this juncture. If it can clear itself free of this trendline, then clearance on the Dow to the upside would obviously be up until 11,100 at the 3/3 peak. Hourly charts are an excellent tool when looking to figure out where near-term support or resistance lies which can be used effectively for intraday trading.
Although we did get a bit of strength later in the day yesterday, it wasn't much when looking at what we call the "top-line" figures in the major averages. Although the Dow managed to tack on 25.05 and the S&P 2.59, the Nasdaq Composite lost a point. Internals finished very mixed and close to parity. Breadth was practically even at the close and so were advance decline lines. Overall volume ticked up by 6% on the NYSE and by 10% on the Nasdaq. Generally when the market goes nowhere but total turnover increases, its a sign of institutional churning or distribution. Get the full report on overall volume patterns for the week in the ShadowTrader Video Weekly as usual. For those of you living under a rock, the new NYSE/Archipelago issue started trading yesterday and was strong out of the gate, closing 13 points above its open. The ticker is NYX. ShadowTrader wants nothing more than for this thing to consolidate for about 2 months and build a base which will no doubt take it higher. One to watch for sure.
Peter Reznicek is Chief Equity Strategist for ShadowTrader.net a subsidiary of thinkorswim, and a Principal of the Prana Fund, a hedge fund. Mr. Reznicek can be reached at preznicek@shadowtrader.net.