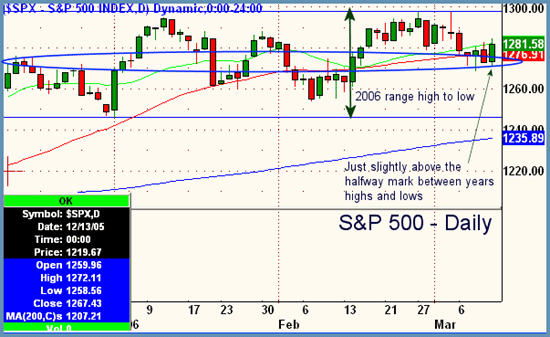
Good Morning, Traders. Plus a hundred on the Dow on Friday and that madman on TV is saying that the market is gonna rally from here. Whatever. Good employment numbers? Who cares? This week was truly dreadful, Friday notwithstanding. While we'll certainly take any strong move when we can get it, keep the snapshot above in mind when doing your analysis of the broad market. We are still backing and filling and have just better than half chance right now of testing 1300 in the S&P as we do of testing 1245. Rule of thumb, whenever a market, index or stock is at a 50% retracement from highs to lows, there is a 50/50 chance of either up or down. Keep that in mind. Let's look deeper at the daily S&P above to see what else we can discern about this sideways market. First thing is the red moving average above which is moving sideways and has no real slope to either direction. The slope of the 50ma daily is one of the easiest ways to quickly take the market's pulse. Very simple. Going sideways, so is the market. Also notice that the last two days of market action in the $SPX are candles lining up same size bodies. The lows and highs are equal and although we broke over Thursday's highs briefly on Friday, we sold off late day to close within the prior days range. Point #2, to get a market moving it has to start closing over and outside of the prior days's range. Duh. Sound obvious, it is and this week we didn't do it even once. Point #3, overall volume increased only 3% on the NYSE in the big Friday rally, while overall volume on the Nasdaq contracted by 16%! Thats not good on a day when the Nasdaq was up 12.32. Last point, we have been talking about the asynchronous nature of the 3 major averages for some time now and will revisit that point again in this weeks video. When you get a spare moment, pull up a weekly of the Dow, then pull up a weekly of the S&P, and then pull up a weekly of the Nasdaq. See the weakness in the Nasdaq? It will be difficult for things to get rolling without some help from tech.
Peter Reznicek is Chief Equity Strategist for ShadowTrader.net a subsidiary of thinkorswim, and a Principal of the Prana Fund, a hedge fund. Mr. Reznicek can be reached at preznicek@shadowtrader.net.