NASDAQ Commentary
Despite a decent Friday, the bulls just didn't have enough fuel to do much of anything this past week - at least not for the NASDAQ Composite. The index lost 40.56 points (-1.76%) to close at 2262.04. It was the first loss in four weeks, although it may not be the last one for a while. On the other hand, the critical support line we've been eyeing has yet to be broken. Read on for our take on the one thing that could spark a rally.
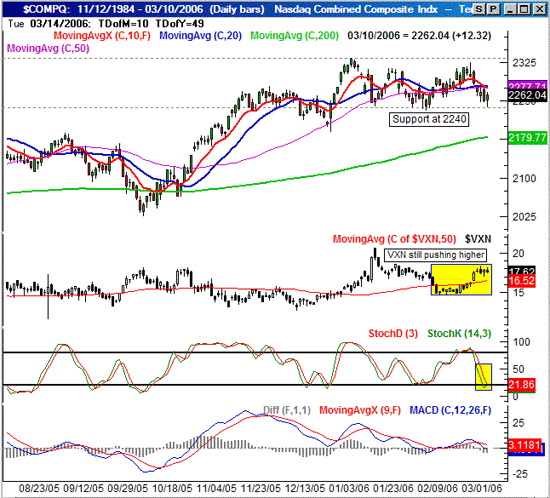
The NASDAQ has been under all the key short-term moving averages for a few days, as we reported in the MidWeek Update. That hasn't changed since then, and is of course, still bearish. Our hesitation was the fact that there has been a key support line at 2240 holding the index aloft since January. Well, guess what our low was this past week.....2239.54! The line, so far, has held for the third time this year.
So then, that's the make-or-break point. If we see a couple of closes under 2238, we'll have to get bearish. That notion is compounded by the fact that the CBOE Volatility Index (VXN) is still on the rise. Yeah, it slowed down this week, but definitely didn't fall. With the VXN moving higher and the market moving lower, we have to call a spade a spade.
On the other hand, we're seeing stochastic lines fall into 'oversold' territory at the same time the composite is resting at the lower end of a pretty regimented range. That's generally where the upside reversals happen, if they're going to.
Caught in the middle? Yep, no doubt about it. As far as the NASDAQ is concerned, it may be worth waiting to see how it all plays out.
NASDAQ Chart

S&P 500 Commentary
The S&P 500's week wasn't quite as rough as the NASDAQ's. These large caps only lost an average of 0.44%, leaving the index at 1281.58 (-5.65 points). But as confusing as the NASDAQ's chart may have been, this one's even worse.
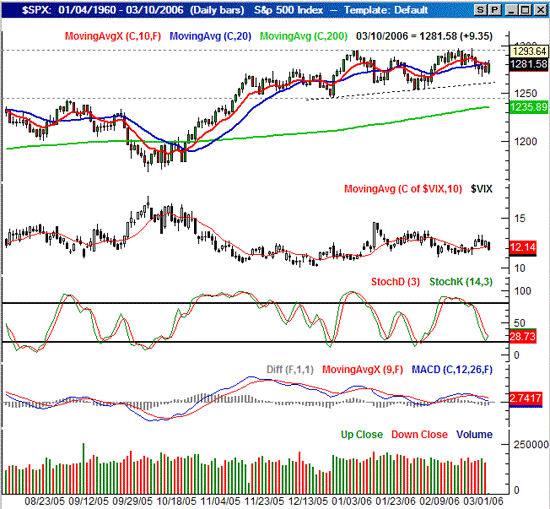
What's bearish? In a word, resistance. The 10 and 20 day lines - both right around1281 - kept the SPX from making any kind of recovery move late in the week. Friday's 9.35 point rally unwound a big chunk of what would have otherwise been a big loss, but we were still in the red for the week. And more importantly, the S&P 500 couldn't climb back above the 10 day line by the close of Friday's trading. That's obviously not bullish.
What's bullish? The bigger trend, the VIX, stochastics, just for starters.
Despite the fact that the S&P 500 has topped out twice just under 1300, we're still seeing progressively higher lows (see the rising dashed line). It's a slow bullish grind, but it's bullish all the same. And look at the falling VIX. Although the NASDAQ's VXN went higher, for some reason, the same sentiment wasn't evident with the S&P's volatility index.....folks are getting a little more bold about these stocks. A falling VIX is bullish for stocks, as long as it keeps falling. And finally, the stochastic lines are itching to move higher. In fact, the %K line (green) is already moving higher, just a day after it brushed on the 'oversold' line at 20.
The one trump card we see to further upside pressure is the VIX. It's pointed lower, but it's still about as low as we've seen it in the modern era. It's just tough to start a real bullish move with a low VIX. Most bull trends usually start with a VIX spike (or peak in fear). As you can see over the last few weeks, any rally has been a false start, accompanied by a VIX that was - and is - just strangely low. For the sake of comparison, go back to the October bottom. It wasn't a huge spike by historical standards, but the VIX's peak around 18 was still a relatively big one. That's what we really need to see to kick start a big move higher. Anything else just means we're apt to stay range-bound between 1240 and 1300.
S&P 500 Chart

Dow Jones Industrial Average Commentary
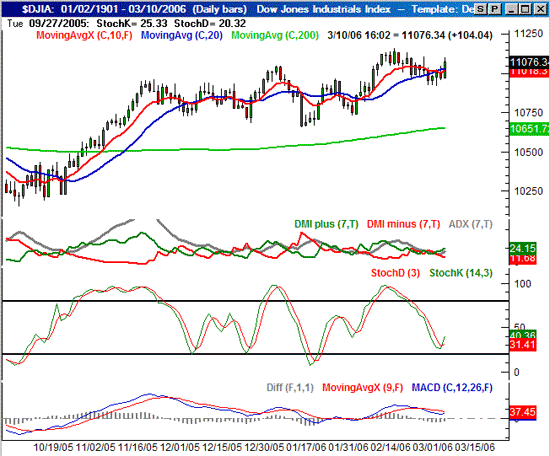
Bucking the trend as usual, the Dow actually moved higher last week. The 55 point gain (+0.5%) left the Dow Jones Industrial Average at 11,077, and back above the 10 and 20 day averages. And as we've been discussing, the migration into the blue chips and out of the speculative names continues to be generally bearish for the market, although that obviously makes the Dow stocks the least of liabilities.
So is that bullish or bearish then? Although we see a clear disparity between the NASDAQ and the Dow, we know that the NASDAQ leads this dance. And while the Dow may not lose as much, it can still lose.....it just didn't do so this week. Eventually, the bigger trend will infect all the indices.
But still, the overall trend (for all indices) isn't perfectly clear. Our other two indices lost ground, but a bullish argument could be made for both. As before, we're skeptical to take any side until we can clearly see the NASDAQ and the S&P 500 break out of their respective ranges.
Dow Jones Industrial Average Chart

Price Headley is the founder and chief analyst of BigTrends.com.