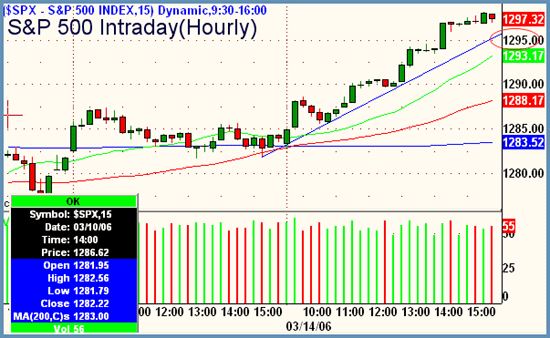
Good Morning, Traders. What a difference a day makes. Finally some straight movement and in the up direction, no less. Stellar rally yesterday after a choppy open that took the Dow up 75, the S&P higher by 13 and the Nasdaq lifting by almost 29. More importantly, the S&P 500 breached the 2006 highs and closed less than a tenth of a point off that benchmark. The Dow did the same, making new highs for the year intraday and then closing strong just under that area. The Nasdaq Composite remains a thorn in the side of the market, not rallying anywhere near the highs for the year and still stuck in a range.
The obvious commentary here would be to just throw up a daily of the S&P 500 and circle yesterday's action and point out where we closed in relation to the prior 2006 high. But this is ShadowTrader, where we pride ourselves on helping the active trader discern where the market is going to go, rather than just replaying where its been. Taking a gander at the mugshot above, take note of the trendline in blue that supports prices from the end of day Monday to the close of yesterday. From an intraday perspective, this line will be very important over the next few trading days. How we approach that line will tell us a lot about where prices will head. If we crack down through it definitively then we retrace a bit and a Fibonacci retracement of roughly 40-50% of Tuesday's move would be inevitable. Keep in mind that price could easily just correct by time and go sideways and then use the blue line as a bounce point to go higher. Either way, intraday trendlines that don't get tested or broken in the day they are formed can always influence price action in the ensuing trading sessions. Sometimes when trading intraday, a pivot will come out of nowhere and you will be left wondering, "why did the market change direction just then?" Very often the reason is a trendline that was formed anwhere from one to five days ago that is simply extrapolating itself forward and now "meeting" price action in the present time. So, in a nutshell, watch the 1295 area in the S&P closely today.
Peter Reznicek is Chief Equity Strategist for ShadowTrader.net a subsidiary of thinkorswim, and a Principal of the Prana Fund, a hedge fund. Mr. Reznicek can be reached at preznicek@shadowtrader.net.