It's been a wild month for all three indices. We've seen some unusual leadership paired with a lack of follow through in either direction. It's important that you read through the comments on each of the three charts below (we'll be brief with them), as clues to the market's next move are multi-faceted. Each chart has its own unique piece of the bigger puzzle.
NASDAQ Commentary
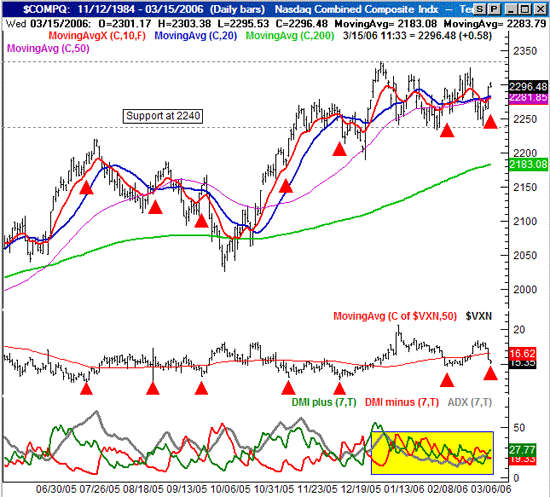
As we've seen all too often in the last few weeks, yesterday's strength has failed to inspire any more buying today. The NASDAQ is in the red by a hair today, yet up by 31.4 points (+1.4%) for the week. The current reading of 2293.43 is above all the key moving averages, but that doesn't mean much at this point. The fact of the matter is that the NASDAQ has been making progressively lower highs, and hasn't taken a leadership role in a while. In general, that's a problem for the bulls.
One thing to get out of the way now....support is at 2240, with resistance at January's high of 2330. That hasn't changed in weeks, and is still going to be our guide for any bugger-picture market calls.
In the meantime, we can see a couple of problems, The CBOE NASDAQ Volatility Index (VXN) fell back to deep lows today, hitting 15.16. A lot of that may have to do with expiration, but it still doesn't change the fact that traders are even more complacent today than they were yesterday, when the NASDAQ was actually rising. All of the major VXN bottoms have been pointed in red on our chart. Most - but not all - of those VXN lows led to problems for stocks. The selloffs may not have been made immediately, but they were still made in most cases. Seeing such a low today at the same time the composite failed to follow through on a major rally doesn't really paint a bullish picture.
Maybe it's nothing. Maybe last week's VXN peak of 18.37 was enough of a peak to jump start a big uptrend. We just don't want to buy into that idea until this chart becomes a lot more efficient. How are we measuring efficiency? Aside from a break above support or below resistance, we're looking at the ADX indicator. The ADX line is still unbelievably low, verifying that this index is trendless. Unless you're willing to trade within that 2240/2330 range, there's not a lot of opportunity just yet.
NASDAQ Chart

S&P 500 Commentary
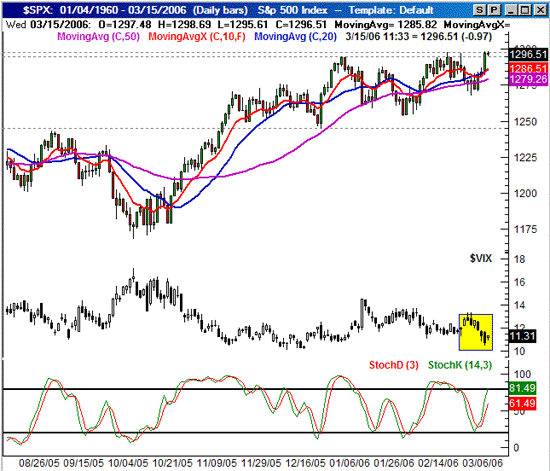
The S&P 500 eclipsed new multi-year highs yesterday, reaching 1298.14. That's a fraction above the February high of 1297.57, but it was still enough. The problem is today's failure to move any higher. In fact, after the SPX hit 1298.69, it fell back to its current reading of 1295.25. That's 2.25 points under yesterday's close, although it's still up by 13.65 points (+1.07%) for the week.
The key issue here (and it's a major one) is the resistance right at 1300. Like clockwork, traders were willing to push the index to that big psychological hurdle, but not one point further. That's the first line that must be crossed before we'd be willing to get bullish. And seeing how we've taken three shots at 1300 and failed with each one (so far), we do have to be sticklers about it.
On the other hand, the bottomed-out VIX may make the issue moot. The CBOE Volatility Index has been falling sharply since last week, but we're seeing upward pressure now with a higher low and higher level today. Of course the day isn't over yet, but the encounter with a major resistance line at the same time the VIX starts to push upward is pretty suspicious.
S&P 500 Chart

Dow Jones Industrials Commentary
The Dow's current reading of 11,150 is about even with yesterday's, while this blue-chip index is up 73 points (+0.66%) for the week. To see the Dow be replaced by the NASDAQ as the market leader is one of the odd shifts in leadership we mentioned above. The Dow Jones Industrial Average chart is by for the most compelling of the three (and has done the best over the last few weeks), but we're seeing interest shift into the more speculative names. This hasn't been the case for a while, which is why we were a little pessimistic on stocks. But to see the NASDAQ start to outperform, we have to wonder if traders are feeling better about being bulls.
But at the same time.....
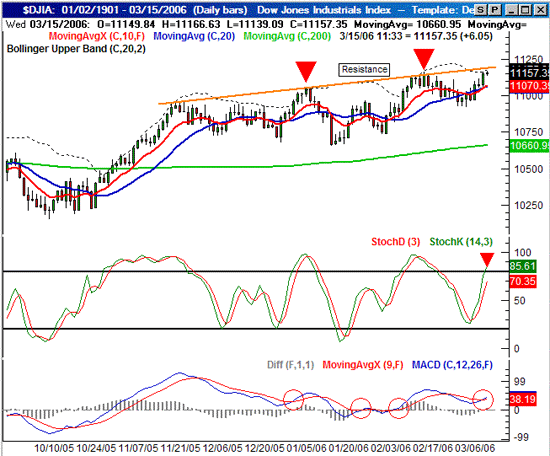
We can't read too much into that rotation. The Dow is also the only index that has been more bullish than bearish recently. As a result, it was the first one to run into a significant resistance line. That's largely today's issue - the resistance at 11,190. Although the Dow has made a nice pattern of new highs every few weeks or so, we're now at the top of that range again. If the pattern holds - which is still uncertain - then the Dow is headed lower soon.
But aren't new highs supposed to be bullish? Usually, yes, but new highs haven't been bullish here in a long time. Since December, two of the three bullish MACD crossovers occurred just a couple of days before a big pullback - after that resistance line was reached. That makes today's MACD cross a little less enticing, especially being stochastically overbought.
Only a break above that resistance would convince us to be bulls. It may happen, but it hasn't yet. So far, the odds favor a pullback to somewhere marginally under the 10 and 20 day averages.
Dow Jones Industrials Chart

Price Headley is the founder and chief analyst of BigTrends.com.