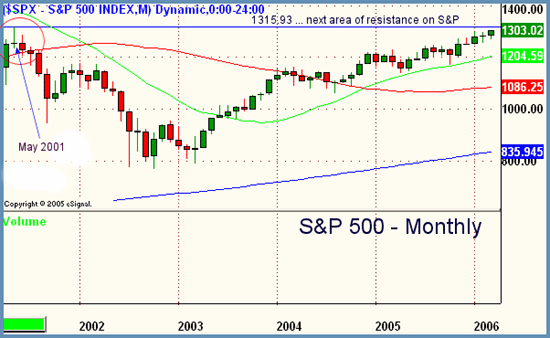
Good Morning, Traders. In yesterday's Big Picture we talked at length about 1295 being a key pivot in the S&P. The low of the day yesterday was 1294.97. Enough said. The market went sideways, correcting by time and not price for the first half of the day on mixed internals and then pulled off a stealth rally later in the day to push the Dow and S&P to new yearly highs again. The Nasdaq is still lagging in the bigger picture and will not be in the same league as its older brethren unless it can crack 2332.92, which is still a ways away for the tech heavy index. The rally was more technically motivated than anything else as economic data was mixed and Fed Beige Book released at 2pm was a rehash of stuff we have heard before. Breadth on the NYSE closed slightly better than 2:1 positive and on the Nasdaq closer to 3:1. Overall volume increased slightly as well, giving the markets an "A" for accumulation. Although the gains were somewhat broadbased, not everything on the ShadowTrader Core Sector List was in the green and only the $GOX (gold mining stocks), was up over 1% from its open. Drugs, Coal and Homebuilders acted as a drag on the bulls party. Going forward we are "in the clear", so to speak on the S&P and Dow, while the Nasdaq is still mired. Also keep in mind that yesterday was the fourth up day in a row for the markets. Generally markets move in cycles that are grouped around odd numbered days. That being said, the bulls may have one more day to run. Looking at a long term (monthly) chart can help us to see how much more room there might be in that run. Notice the resistance in the circled area at left in the chart above. The resistance of 1315 from spring of 2001 is the next pivot. This is more than likely where the S&P is headed in the near term. Overall bias remains upward, with the near-term bias shifting to up as well.
Peter Reznicek is Chief Equity Strategist for ShadowTrader.net a subsidiary of thinkorswim, and a Principal of the Prana Fund, a hedge fund. Mr. Reznicek can be reached at preznicek@shadowtrader.net.