Although it's not my focus, plenty of you have been asking us for my thoughts on commodities and currencies. So today, we'll take a side trip and examine oil (and heating oil), as well as take a look at the U.S. dollar. I think there's something useful here for everyone, even if you don't directly trade futures or currencies.
U.S. Dollar
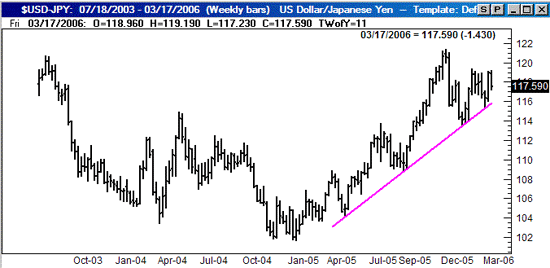
Let's start with the U.S. dollar. Our last look at the sawbuck was on December 6. At the time, the dollar/yen exchange rate was at 120.73, which was as high as we'd seen it since mid-2003. And it was still going higher. Between then and now, a lot of industry experts were looking for the dollar to fall back again, and turn as weak as it was in 2004. We too were looking for a little weakness, but only to the extent of a mild correction within a bigger uptrend. Not trying to gloat here, but so far, that correction and recovery is pretty much what we've seen....and the dollar is certainly not in the major trouble a lot of pundits were calling for.
We said it then, and we still say it now - the dollar is in a recovery mode. That December/January dip was the result of an extreme overbought condition. Now that condition no longer exists, and we've seen the dollar/yen move back up to 117.59 from January's low of 113.38. The long-term support line is now at 115.80, which is our make-or-break point for this chart. Of course, that line should be adjusted accordingly. Take a look at the chart, then read below for our final thoughts on the dollar.
Dollar/Yen - Weekly

So why is the dollar still improving? This was something we discussed long ago, but the bottom line is the dynamic between inflation and interest rates. The dollar was weak in 2004 because interest rates were so low while inflation was pretty high. In that scenario, why would anybody want to own a dollar? It was a liability. Since then, inflation is being contained, and interest rates are rising. The dollar is no longer a liability. That's why it's back in demand. As long as that's the case, we're looking for the dollar to stay pointed in this direction. It really is as simple as that.
Crude Oil
Is there any end in sight? We can definitely see a little softness here (finally), although the buyers are still fighting a good fight. That leaves crude prices stick in the middle somewhere, unable to go higher or lower.
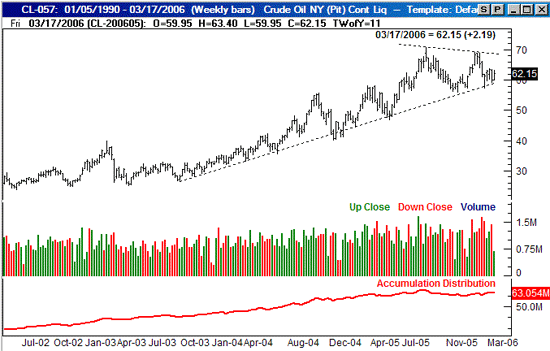
Going all the way back to 2003, we can draw a support line (the support line) that's been guiding crude oil futures higher. It's been a wild ride, but hat line was never really been breached, except in a very marginal way in mid-2004. As long as it holds, the price of oil is still technically on the rise. That support line is currently at 59.00, but should be adjusted upward every day.
However, we saw something in January that we haven't seen in a long time that could be used to make a bearish case. January's peak of 69.20 fell a little short of the September peak at 70.85 (on continuous futures contracts). Technically speaking, a lower high represents a waning degree of buying interest. We've not yet seen a lower low, and we might not for a while. Additionally, the buying volume has tapered off. The accumulation-distribution line at the bottom of the graph shows a flattening trend. That's not exactly bearish, but it sure isn't as bullish as it was between 2002 and the latter part of 2005. We can safely say that things are at least a little different for oil than they were a few months ago.
Take look at this chart, and be sure to keep an eye on the lower support line as well as the January peak level of 69.00.
Crude Oil Futures Contracts - Weekly

Heating Oil
If crude oil is off our normal beaten path, then heating oil is downright obscure. However, we do look at it from time to time, if only with a passing interest.
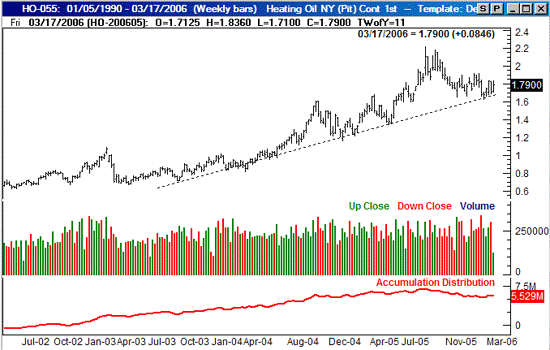
Our last look at heating oil was on October 25. At the time, heating oil futures were at 1.866, and coming off a peak of 2.22. We were expecting heating oil to continue to dwindle, and end up closer to the support line that was around 1.50 at the time. That's pretty much what we got, although the support line was at 1.60 by the time the futures got there in February.
Now we can see that heating oil futures are bouncing off of that support line. We're going to take that at face value and assume this chart is still in its bigger uptrend. That long-term support is now at 1.65. The one potential red flag here is volume. Heating oil has been in distribution mode for a while, and if that persists, a lack of buyers will eventually mean a lack up upward movement. Demand for heating oil comes and goes in spurts though, and is largely unseasonal. So, don't come to any calendar-based conclusions.
Heating Oil Futures Contracts - Weekly

Next time we'll look at gold's heroic run, and natural gas. If you have any other commodity-based or currency-based requests, send them in. We'll be glad to share our thoughts on the specific markets you watch.
Price Headley is the founder and chief analyst of BigTrends.com.