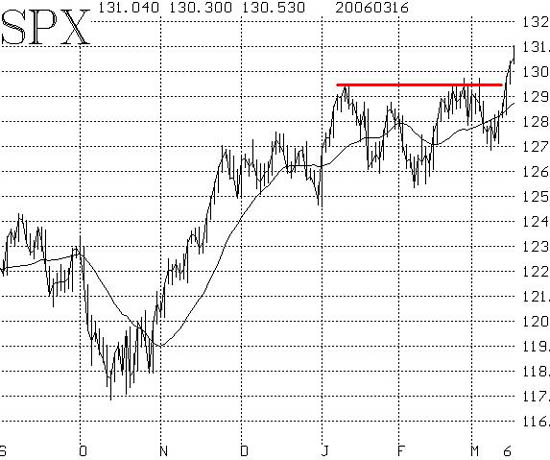
Traders have been frustrated by this market's inability to hold what appeared to be breakout moves -- on both the upside and the downside. Nevertheless, this one looks like it might have "staying power." Both $SPX and $DJX (the Dow) have broken out to new 5-year highs, and appear to be holding the breakout levels. QQQQ is not nearly in as good shape, but a close above 42 would be constructive for that index as well.
Most of our technical indicators are falling into line with this breakout move, although it is still the case that none have given true buy signals for quite a while. For example, market breadth has expanded nicely in the last few days as $SPX approached the 1295 resistance area and then broke on through. Prior to that, though, there was not a true oversold condition which would have been a proven buy signal.

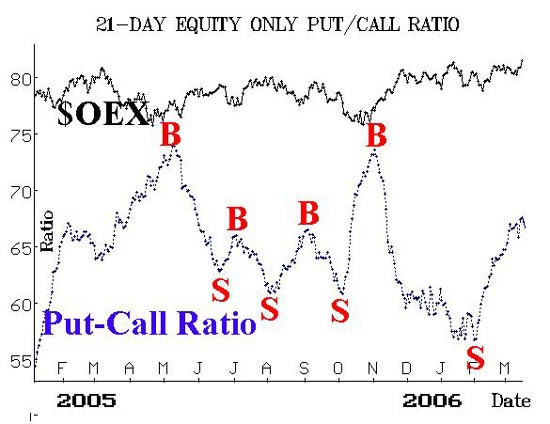
The one problem we've had all along is that the equity-only put-call ratios have remained on sell signals since early February. They are still on sell signals, but if you look closely, you will see that they "ticked" downward after Wednesday's close. Buy signals will arise if they roll over and begin to trend downward. This could be the beginning of such a signal.

You might also notice that there was a sharp downward spike, followed by an upward spike about 4 days ago -- on both put-call charts. That was an artificial move caused by dividend arbitrage in Altria (MO). Last Friday, over 2.4 million call options traded in MO, prior to Monday's ex-dividend of 70 cents. That was a huge amount of call volume, and it caused the put-call ratios to spike downward. However, by the next day, the "regular" option activity in the overall market returned, pushing the ratios to new highs and keeping them on sell signals.
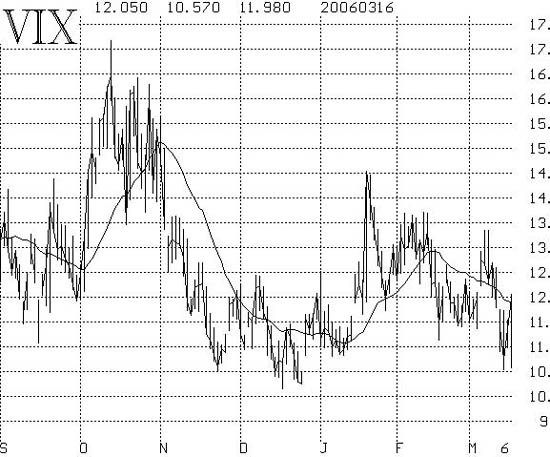
Finally, $VIX fell to near its historic lows recently. That is bullish.You can see the breakdown in the chart in Figure 4. The close below 11.50 was the confirmation that any bearish scenario from $VIX was dead, and the bulls took control. As long as $VIX remains at these low levels, the market can continue to rise.

In summary, we look for $SPX to run to the 1320-1325 area at least. That's commensurate with the move that took place near the first of the year when the market broke out to the upside at that time. This is more important than the fact that it's been three years since this market had a meaningful correction, or the fact that the mid-year of the Presidential Cycle (this year) usually sees a sharp decline into a good trading bottom. Those longer-term facts may lead to a decline later this year, but for now the bulls have the upper hand and -- for once -- seem to be taking advantage of it.
Lawrence G. McMillan is the author of two best selling books on options, including Options as a Strategic Investment, recognized as essential resources for any serious option trader's library. Sign up today and take an extra 10% off tuition for Larry's 2-Day Intensive Options Seminar on May 20 & 21 in Houston.