Cigarettes Cause Cancer
The surgeon general warns that "Smoking Causes Lung Cancer, Heart Disease, Emphysema, and May Complicate Pregnancy". But, did you know that it has never been proven? How could anyone say that? Well, the truth is we all know that cigarette smoking causes cancer, but in the true scientific sense, an experiment has never been performed. That is, no one has ever taken a group of hundreds of smokers and hundreds of non-smokers and made half them smoke while the other half did not to see who got cancer and who didn't. There have been after-the-fact surveys, but no experiments. However, the correlation between smoking and cancer is so high that virtually all doctors and scientists agree that cigarettes cause lung cancer (doctors who own Phillip Morris stock may disagree).
Correlation, Causation and the Trader's Wallet
So why is correlation and causation so important to traders? It's simple. Virtually all traders have a system which relies on certain indicators. Some individuals believe that their indicators can predict the future. Others believe that indicators increase their odds. A few years ago, there was an article at a popular website, in which the writer observed that if you take the top 5 highest-priced stocks in a certain index and bought the one that was most recently added to the index and held it for the year that this method had historically earned 15% returns. Well, after the article was published the method returned a dismal 2% return a year, while the market averaged 9%. Readers should have taken this into consideration: Could being added to the list most recently and having a top five price really cause the price to go higher? That is unlikely.
Not So Fast
One thing that we must recognize as human beings is that we tend to simplify things. We tend to draw conclusions much too quickly. That is the whole reason there are stereotypes. Someone might say that all women don't like sports, and then low and behold a great number of women love sports. One of the reasons that humans draw conclusions and stereotypes quickly is that doing so simplifies things. It allows stereotypers and wannabe market geniuses the luxury of not having to ask questions and to do hard research. In other words, quickly drawing conclusions and stereotypes is the easy way out. And most of us know that the effortless way to do things is often the worst way. So, we must be careful with how quickly we come to conclusions.
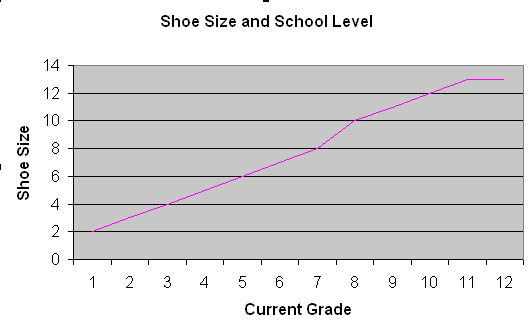
Here is a great example: This is chart showing the extremely high correlation between school grade level and shoe size.

Here is a yearly chart of typical shoe size plotted against the current grade in school. The 2 are highly correlated. If a trader looked at these 2 items and saw the level of correlation between them, the trader would probably buy the stock as I went into college (grades 13-16) and expected the shoe size to increase since it has historically for quite some time. Well that would be wrong. Because although the 2 are highly correlated (R-squared above .90), one does not cause the other and therefore current grade has no predictive value. So, watch out for high correlation between items where none can be found. Also, collect as much data as possible.
The same thing happens in the stock market. Some indicators show a high level of correlation but there is no causation involved. However, just like in cigarettes, sometimes there is such a high level of correlation that causation cannot be denied. Ultimately, we are looking for strong indicators with a high probability of success as well as causation when possible.
CBOE Put/Call Ratio
The Chicago Board of Options Exchange (CBOE) put to call ratio is an excellent example. It has been a high probability indicator for years now. Is there any causation there? There is. The put to call ratio is an accurate measure of speculative buying in the marketplace as well as an excellent measure of investor sentiment. Earnings do drive the market, but ultimately it is investors' reaction and the prevailing sentiment that determines who is going to buy and who is going to sell. When investor sentiment is extremely optimistic, buying pressure is totally exhausted and there is little room for the upside. This is exactly what happened in the year 2000.
So the lesson here is this:
- be very careful of how quickly you draw conclusions from two items that seem to have a high level of correlation
- look for causation whenever possible
- review indicators at least semi-annually to test their effectiveness
- collect as much data as possible before drawing conclusions
Be disciplined, and trade well!
Price Headley is the founder and chief analyst of BigTrends.com.