NASDAQ Commentary
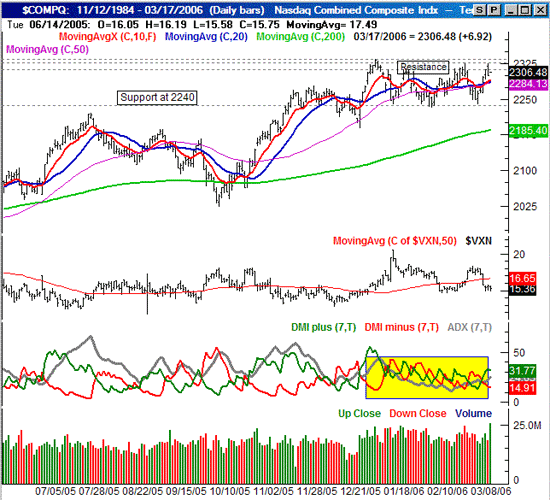
The NASDAQ Composite ended the week 44.44 points higher than where it started, closing at 2306.48 on Friday. That 1.96 percent gain was more than enough to get the index back above all the key moving averages, but that's about all the bulls could muster. The NASDAQ, even with all its recent action, is still stuck in a rut.
Although the NASDAQ closed higher for the week, there were a couple of key resistance lines redefined in the process. Wednesday's and Friday's highs near 2311 basically matched the levels where the composite topped out in early March and late January. Thursday's high of 2323.79 was obviously above that, but the high from that day matched the intra-day high from March 3rd (which was right in the middle of the period where 2311was verified as resistance). Point being, although the other two indices aren't having much of a problem getting into new-high territory, the NASDAQ is. Based on this lack of leadership from the index that should be leading, we remain cautious about any continued bullishness. Then again, we're seeing a great deal of bullish volume emerge, so this could indeed be the real thing.
In any case, the NASDAQ is still range-bound, between 2240 and 2333 (and don't forget about the resistance lines under 2333. As before, we're really waiting for a break outside that box.
NASDAQ Chart

S&P 500 Commentary
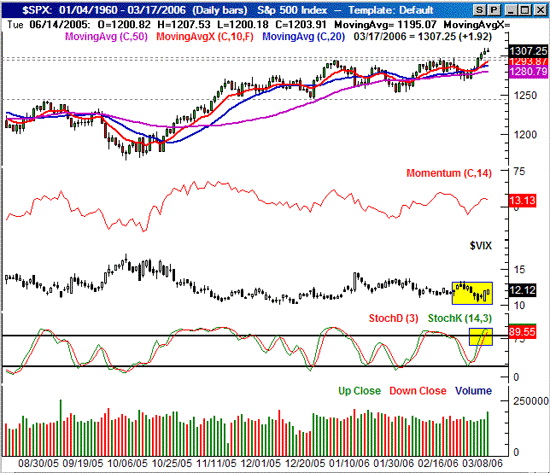
All in all it wasn't a bad week for the S&P 500. These stocks gained an average of 2.0 percent, leaving the SPX at 1307.25 on Friday. That's a 25.65 point improvement from the previous week.
It's been ugly, but we've still seen it happen. The SPX has consecutively hit new multi-year highs for the past five months. There was a significant pullback after each instance of this feat, but each of those dips was also a little higher than the last one. So, overall, we have to remain bullish in the (much) bigger picture. That's pretty good for investors, but can be torture for traders.
The key thing to note here is that resistance at 1300 was breached, allowing the index to hit new highs. But then again, the SPX has made a habit of hitting new highs, then retracing much of that gain. The odds barely favor the same scenario this time around. We're stochastically overbought, and the VIX has started to creep higher. Add in the fact that the rate of gain for the chart has slowed down, and you actually end up with a bull trend that is weakening fast. Depending on your timeframe (as we said above), what to do all depends on what you're trying to accomplish. If we see a bearish bar or two in the coming week, we'll look for the SPX to drift about 20 points lower. If instead the S&P 500 can hold this ground for a few days, that might keep the profit-takers at the door, and let some more buyers into the game - kind of like what we saw in October. Patience is still in order.
S&P 500 Chart

Dow Jones Industrial Average Commentary
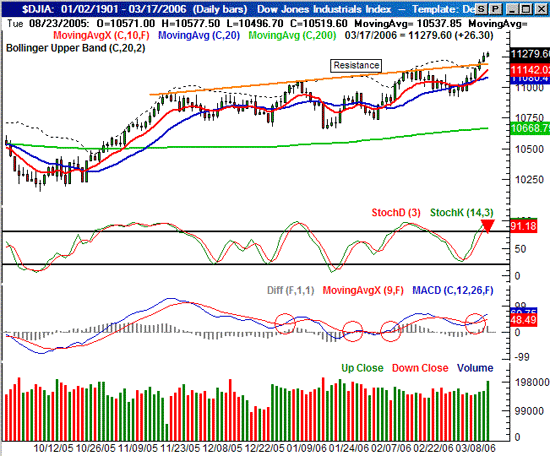
The Dow was the weakest sister this week - barely. The 1.86 percent gain was just 10 basis points under the NASDAQ's rally, and just 14 basis points behind the S&P 500's. So all in all, we'd have to say that the indices participated equally in this week's gains. As far as the Dow was concerned, the 203 point addition meant a close at 11,280. That was a new multi-year high close, while Thursday's high of 11,325 was a multi-year intra-day high. Not bad at all.
In Wednesday's MidWeek Update we pointed out that the Dow was likely to pull back now that a major resistance line had been encountered. Of course it was a bullish resistance line, so any dip would still have to be taken with a grain of salt. Instead of the Dow complying with our expectation, the blue chips managed to break above that resistance line. That - at least a small degree - is going to force us to start thinking about some tools that are not so reversal-based (i.e. momentum tools, like MACD).
So while we're at a crossroads of sorts, we'll still contend that caution is on order until we get some conformations. The October recovery came with little to no warning, so another big leg up isn't out of the question. The problem is that this past week may have been a little skewed by option expiration. The one argument the bulls have in their favor, though, is that volume is clearly improving. We'll have some more detail by Wednesday's mid-week update.
Dow Jones Industrial Average Chart

Price Headley is the founder and chief analyst of BigTrends.com.