| ShadowTrader Big Picture Market Analysis for March 20 |
| By Peter Reznicek |
Published
03/20/2006
|
Stocks
|
Unrated
|
|
|
|
ShadowTrader Big Picture Market Analysis for March 20
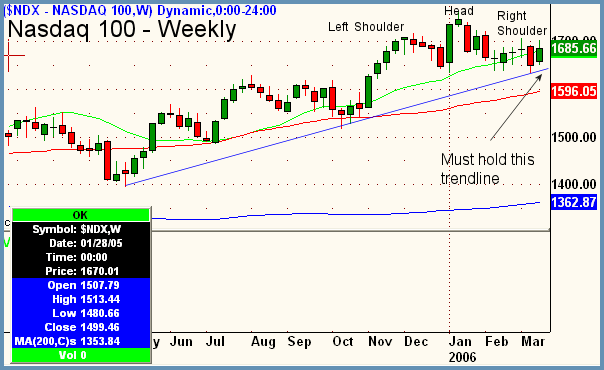
Good Morning, Traders. Quite a bullish week in the markets as the S&P and Dow were both up for all five trading days of the week. When everything is up and sentiment is overtly bullish its probably prudent to give some focus to something negative in the markets. If there is an Achilles heel to this rally, then its obviously the Nasdaq which is still struggling to break out over 2006 highs as the Dow fast approaches all time highs. So, in the spirit of negativity the Big Picture puts the $NDX or Nasdaq 100 as the chart of the day, seen above. There is an ominous head and shoulders pattern in the weekly which has certainly not followed through to the downside, but still should be taken into consideration. Basically, as we have mentioned many times in this commentary, a rally that is not broadbased (including tech), might not be much of a rally. If the leaders (Nasdaq 100 stocks) in the Nasdaq cannot follow through and provide leadership then its certainly something to note. The trendline (blue) that is currently supporting in this index is the key. If we bounce here and use it as support then the head and shoulders will be a failed pattern and buyers will come forward in full force. The key pivot for that to happen (heads up, QQQQ traders) would be 1706.41. Any $NDX readings over this level would pretty much render the head and shoulders a pattern failure and we keep going up. If the trendline is lost to the downside, then obviously the pattern stays intact, follows through and the Nasdaq Composite will start to act as even more of a drag on the markets than it already is. When the markets are asynchronous like this your best bet is always strong consolidations on larger timeframes such as weeklies. Stocks that build strong bases on weeklies tend to eventually break out of those bases and begin another stage of advance. Here's four that fit that category.
Focus List of Stocks

KEM - Kemet Corporation
Industry - Electronics
Side - Long
Trigger - 9.21
Stop - 8.50
Target - 10.16
Timeframe - 2 weeks to one month
Notes - KEM originally listed long in Focus List on 2/17, but didn't trigger
- Stock has since then chopped around and extended its weekly base
- Trigger and stop over and under body of weekly bar
- Target to 200ma (blue) overhead
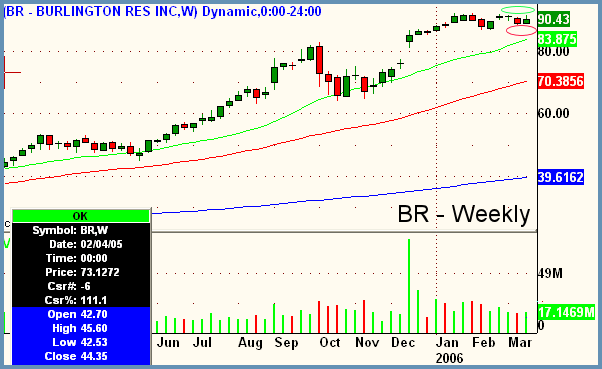
BR - Burlington Resources
Industry - Oil & Gas (Independent)
Side - Long
Trigger - 92.50
Stop - 88.58
Target - 100.00+
Timeframe - multi week to multi month
Notes - Probably the strongest looking chart in this sector
- Perfect cup and handle on weekly with long consolidation at highs, indicating correction by time and not price
- Trigger is over highs of consolidation and stop just under lows of last four weeks which are a higher low than in beginning of consolidation (bullish)

MICC - Millicom International Cellular
Industry - Communications (Wireless)
Side - Long
Trigger - 42.77
Stop - 40.79
Target - 46.00+
Timeframe - 2 weeks to multi month
Notes - Originally listed on Focus List of March 7th (with daily chart setup) but has not triggered yet
- Since first mention, stock has continued consolidating at highs and is now listed with trade parameters off of weekly bars
- Very strong consolidation at 52 week highs after high volume breakout
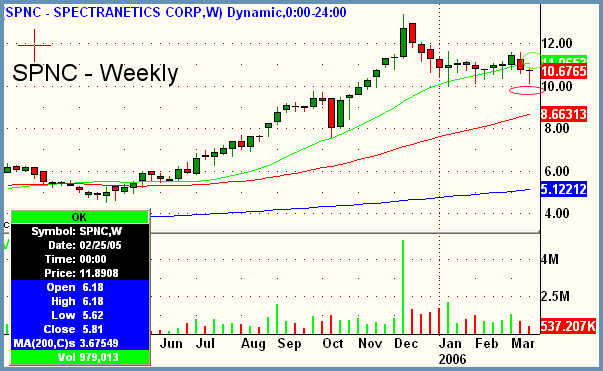
SPNC - Spectranetics Corporation
Industry - Medical Equipment
Side - Long
Trigger - 10.94
Stop - 9.95
Target - 13.38+
Timeframe - multi week to multi month
Notes - Triple bottom on weeklies along with weekly hammer last week
- Entry over top of last weeks hammer and stop below consolidation
- Target to test prior highs in late '05
Peter Reznicek is the Chief Equity Strategist and a principal of the Prana Fund, a domestic hedge fund, and ShadowTrader, a subsidiary of thinkorswim which provides coaching and education to its clients on both intraday and swing trading of equities. For a free trial to the full version of The Big Picture or to learn about ShadowTrader's other services, visit shadowtrader.net or send an email to preznicek@shadowtrader.net.
|


 Free Festival of Traders Videos