Good morning! The market certainly decided that it was time for some better intraday trending action on Tuesday.... It just had a hard time making up it's mind as to which way to go! It wasn't until the last half of the day that the market finally resolved itself to a breakdown, giving way to the bearish sentiments we had heading into the day. The Dow Jones Industrial Average closed down 39.06 points at 11,235.47. The S&P 500 lost 7.85 points to close at 1,297.23, while the Nasdaq Composite lost 19.88 points to end the day at 2,294.23.
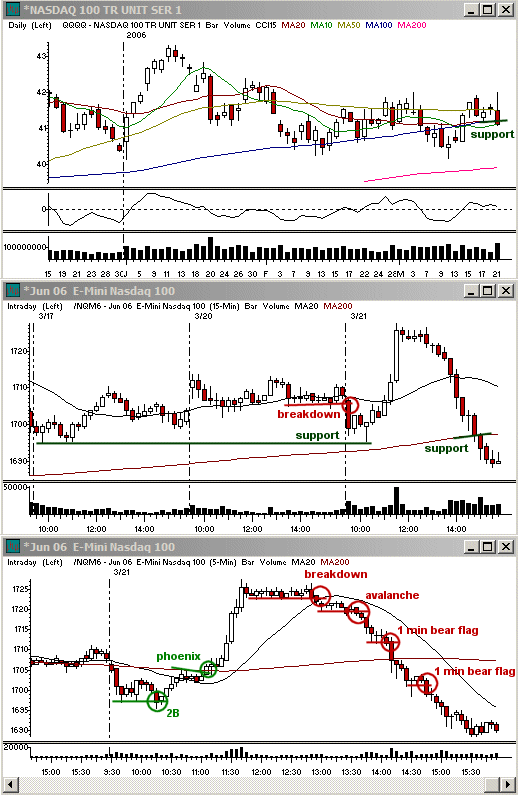
Initially, the market did support our bearish bias. Both the S&P 500 and Nasdaq moved strongly to the downside out of the gate on Tuesday. They both had a more difficult time holding onto those losses, however, in light of the stronger Dow action. The Dow Jones Industrial Average was bound and determined to try for that stronger test of a daily equal move as compared to February's rally. As such, it saw a lot slower selling out of the open, creating some decent buy setups on the 2 and 5 minute charts going into lunch on Tuesday. The Nasdaq helped as it created a 5 minute 2B pattern by trapping new lows at the 10:15 ET reversal period. Both the Nasdaq and the S&P 500 then pulled up into the 5 minute 20 sma zone, based to form a Phoenix buy setup, and then broke strongly to new intraday highs going into noon.
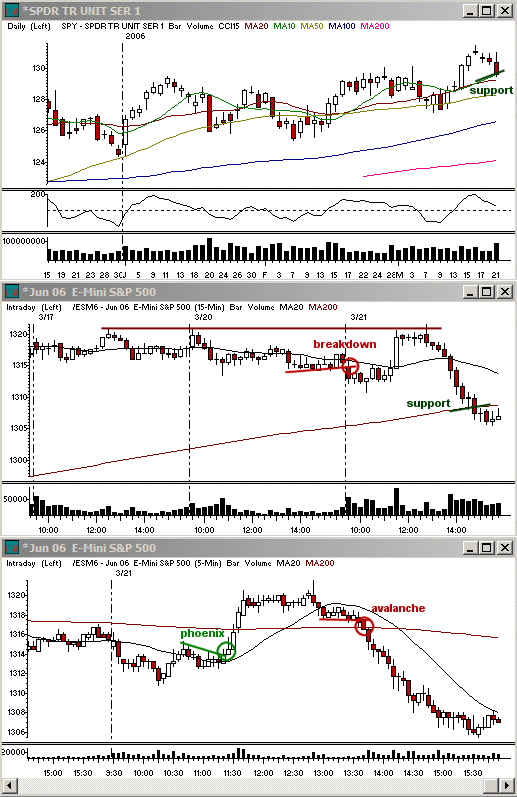
While the late morning rally was a strong one, the daily charts had already had a decent upside rally. This continuation of the move simply took the Dow into the stronger equal move on the daily charts. As soon as that hit, along with the prior highs on the S&P 500, the bulls had a much more difficult time holding onto their gains. Initially the market based at the mid-day highs, with volume declining as the base progressed. Since the rally was a great deal more extreme than usual, the correction period will often be longer than average before a continuation move can occur. Average is 1.5 to 2 times the rally. In this case, the market attempted to break early too soon into the afternoon, hence trapping those buying the new high and then reversing sharply into the remainder of the day.
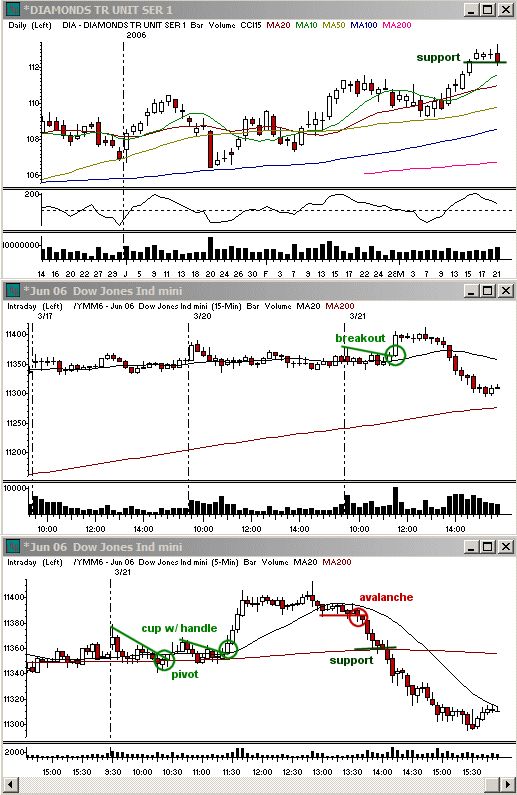
The afternoon action was very decisive. After pivoting off highs, the indices formed a 5 minute Avalanche reversal pattern by basing along support from 13:00-13:45 ET before breaking lower. Volume began to increase and the market put in three comparable waves of selling on the 1-2 minutes charts before the pace began to slow down a bit around 14:30 ET. The market still put in once more wave of downside into 15:00, but the action was slower and that slowdown continued into the close.
Coming off the larger upside trap pattern, the market was not able to form a decent correction to selling before the end of the day. It is likely that the selling with continue as the week progresses, creating a greater correction on the daily charts off the recent highs from over the course of the past week.
Economic Reports and Events
Mar 22: Crude Inventories 03/17 (10:30 am)
Mar 23: Initial Claims 03/18 (8:30 am), Existing Home Sales for Feb. (10:00 am)
Mar 24: Durable Orders for Feb. (8:30 am), New Home Sales for Feb. (10:00 am)
Mar 27: -
Mar 28: -
Earnings Announcements of Interest
Only stocks with an average daily volume of 500K+ are listed. List may not be complete so be sure to always check your stock's earnings date before holding a position overnight. (A) = Earnings after the close, (B) = Earnings before the open, (?) = Earnings time not specified at the time of this writing
Mar 22: ADBE (A), DRI (?), FDX (B), KBH (A), JBL (A), MS (?), IPG (B)
Mar 23: COMS (A), APOL (B), BGO (A), CCL (?), CAG (B), EGO (B), FDO (B), FINL (4:15 pm ET), FRED (B), GIS (B), POL (?), SLR (A), WTSLA (A)
Mar 24: -
Mar 27: WAG (?)
Mar 28: LEN (B), PAYX (A), RHAT (A), TIBX (A), TIF (B)
Note: All economic numbers and earnings reports are in lines with those compiled by Yahoo Finance. Occasionally changes will occur that are made after the posting of this column.
Toni Hansen is President and Co-founder of the Bastiat Group, Inc., and runs the popular Trading From Main Street. She can be reached at Toni@tradingfrommainstreet.com.


 Free Festival of Traders Videos