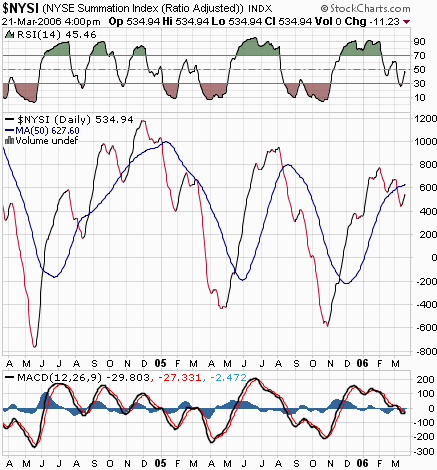
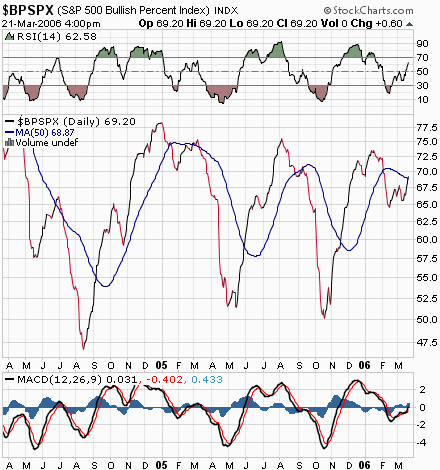
In the past I've talked about two of my favorite indicators from the website StockCharts.com, the NYSE Summation indicator ($NYSI) and the Bullish Percent on the S&P 500 ($BPSPX).
The NYSE Summation Index ($NYSI) measures the gap between advancers and decliners on the New York Stock Exchange. As advancers outnumber decliners, these positive numbers are summed to create a rising Summation line, while when decliners start to win out, that negative weight will subtract from the Summation and eventually lead to a declining line.
In addition to plotting the RSI and MACD indicators, you can see that the NYSE continues in a bear trend for now as the Summation Index has broken below its 50-day moving average (in blue). This bearish break will be confirmed once the 50-day moving average starts rolling over to the downside. You can see that once we hit the historically low levels around the -400 level where an oversold market will soon bounce, then it will be time to buy. But for now, this market is closer to a peak than a bottom. So until then, we must follow the trend which is still to the downside for now.
NYSE Summation Index ($NYSI)

The Bullish Percent on the S&P 500 ($BPSPX) is repeating a pattern similar to what we saw in early 2005. The idea here is what percentage of stocks are in bullish point & figure charts patterns, and you actually want to see a small percentage of bullish charts to form a contrarian bottom once the indicator turns back up. Yet after an overbought mode in December 2005, and then a minor oversold condition, the Bullish Percent is nearing overbought again. Meanwhile, the trend as measured by teh 50-day moving average has rolled over to now be heading lower. Only when the Bullish Percent hits around the 50% level on the S&P 500 does the market tend to bottom and recover. And based on Tuesday's attempted rally to a new intraday high followed by a downside reversal, the timing may just be right to catch a fairly quick and potentially sharp swoon in the markets over the next few weeks.
Bullish Percent on the S&P 500 ($BPSPX)

Price Headley is the founder and chief analyst of BigTrends.com.