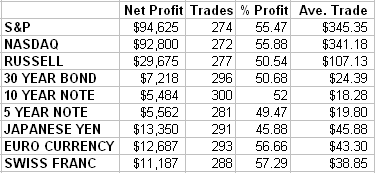
Maybe this would be a good time to list all the simple biases in we’ve identified to date. Unless otherwise stated, each indicator suggests an entry (long or short) on the open, and an exit on the close.
The following are all BULLISH — the reverse is bearish:
1. The 2-day daily closing average is less than the 5-day closing average.
2. The highest close of the last 50 days comes before the lowest close of the last 50 days.
3. The close is greater than the 40-day average close .
4. The close is greater than the previous close and the range was less than the 10-day average range—OR the close is less than the previous close and the range is greater than the average 10-day range. Again, this is a 2-part buy scenario—(short sales come from lower close with narrow range or higher close with greater range than the 10-day
average range).
5. Five successively lower closes followed by an up close.
6. Four successively higher closes followed by a down close and then ignoring the next day (direction is unimportant).
7. The previous close was less than the previous open.
8. Yesterday’s close was less than the open and the same was true for the day before.
9. At least two out of the last three open to closes were negative.
10. The close is greater than the 15-day median. (15 highs plus 15 lows divided by 30).
11. CUP-CAP day trade. (see following * for original overnight concept)—Buy on open, sell on close if CUP has a lower low than both today and the previous three days.
* A play for in-on-the-close, out-on-the-next-open that persists across all futures markets. For buy (CUP), last 3 daily bars feature a lowest low and a lowest close both occurring in day 2 -- the middle day. For short sales (CAP), 3 daily bars feature a highest high and a highest close in day 2.
For years, you’d get an upside bias following a down day (close to close) across the commodity universe. That hasn’t held up in recent years, but it may be worth noting anyway because of how pronounced the tendency once was.
Finally, here’s a variation on the two open-to-close fade idea. It works better in most of our targeted markets over our normal five year history if the second open to close is larger (either positive or negative).

Art Collins is the author of Market Beaters, a collection of interviews with renowned mechanical traders. He is currently working on a second volume. E-mail Art at artcollins@ameritech.net.