I've got a two charts to look at today. It's just some charts of a trade I entered recently that could be considered a "textbook" example of several technical analysis techniques. It will at least be a good reminder of why it pays to use a collection of indicators rather than just one.
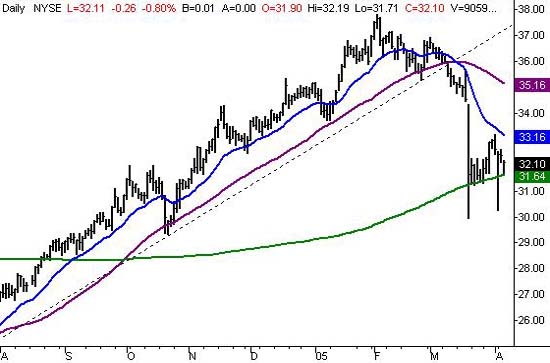
Let's first look at a longer-term chart. The stock had been on a roll since last August. Support was usually found at its 20 day line (blue), and when it dipped under that average, there was a support line (dashed) as well as a 50 day moving average (purple) that forced a recovery. That support had become pretty reliable.....maybe a little too reliable. When FAF shares fell under the 50 day line and the support line back on March 9, and then moved even lower on the 10th, we knew something was up (or down, in this case). It was only a mild tumble at the time, but when we see significant support suddenly broken, there's a reason. We shorted it on the 10th, and on the 18th, the stock finally got crushed, hitting a low of 30.00 before recovering to close at 31.63. By that time though, the damage had been done. But the point we're trying to make is that the charts told us this was likely to happen - it was just a matter of opening our eyes and paying attention (something anybody could have done). Take a look at this chart before we zoom in on the next one.
First American Corporation (FAF) - Far

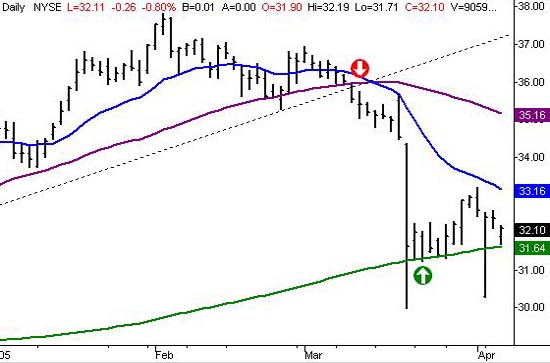
This is the same stock (FAF), but we've zoomed in on this chart so we can get a really close look at a couple of things. The red arrow pointing lower shows the point where we placed the trade. This was going to be the second close under the support line as well as under the 50 day line - that's a telltale sign that pays to heed. But look where the plunge was stopped. Although the stock traded under it for a brief period on the 18th, we've yet to see a close under the 200 day average (green). Even novice traders should know that the 200 day line is the indicator of the biggest of the big trends, and it's also a point that many investors use as a buy or sell signal. In this instance, it was used as a buying point. What is uncanny is just how well this line has acted as support over the last two weeks. There are two minor exceptions, but it's clear in the way that the lows are tracing the 200 day line that there is some long-term buying interest in First American. Had we not plotted the 200 day line we may have never even considered that the bleeding would stop here, but now that we have seen it, we have to be ready to make an exit if it looks like the support will serve as a springboard. In other words, we're still in the trade for the time being, and whether or not we stay in it will depend on whether or not we'll cross under the 200 day average.
First American Corporation (FAF) - Close up

Implications
There are a couple of lessons to be learned, or re-learned, as the case may be. First, you have to pay attention to the obvious. Like we said above, these were classic technical analysis signals....and they were correct. But, being as simple as they were, a lot of traders (and we're not immune to this) would have dismissed them in search of something more extravagant. We constantly build and rebuild trading systems, but it truly seems like the best ones are the simplest ones. The second thing to be learned is to use multiple tools. There is a danger of using too many indicators, as it leads to paralysis through analysis. But in this case, the combination of the 50 day line as the entry - and the 200 day line as the potential exit - allows us to not fly by the seat of our pants. Instead, now that we have some profit, we can set specific exit parameters using our chart's lines.
Are charts always clean and obvious like this? Rarely. Most charts are ambiguous. That's why it's so important to take action when you do get the obvious setup like this, even though it may or may not pan out. Remember the 80/20 rule....80% of your profits come from 20% of your trades. You just have to be sure to take all of the high-probability setups you see, so you can be sure you'll get the occasional big winner you need. And when you get a freebie staring you in the face like FAF did for us, you have to open your eyes enough to be able to see it.
Price Headley is the founder and chief analyst of BigTrends.com.