The first thing to note about this market is that is has absolutely no follow-through at all. So far the market has flip-flopped nearly every day this week. A cynic might say that with action like that, you don't even need technical indicators. Just watch the opening and go that way with the market all day. It rarely reverses intraday anymore. This is partly due to the uniformity of institutional order flow these days. It's as if these guys are reading from the same playbook. Whatever piece of news they want to attach themselves to in the morning, they enter a flood of orders that way for the day. But that's it; there is no further similar order flow for the next day. In fact, on the next day, they might completely reverse themselves if they suddenly get the urge.
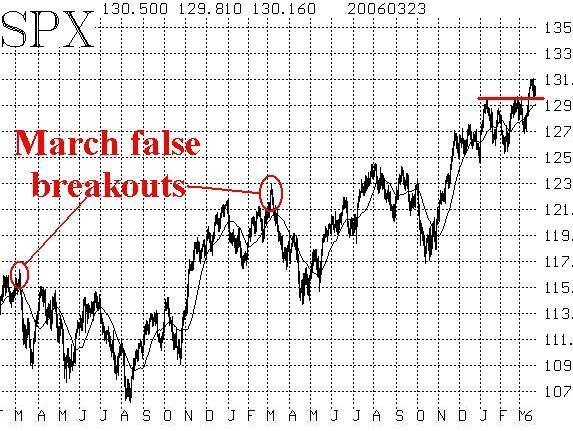
In any case, let's review the technical indicators, just in case this market ever regains a semblance of momentum. The SPX and DJX charts are still bullish. After SPX broke out over 1295, it has retested that area, but not violated it (horizontal red line on the chart in Figure 1). That is positive. DJX is even stronger, but QQQQ is much weaker. When QQQQ is the weakest, that is bad for the general health of the market.

There is another thing that is marked on Figure 1, however, and it is much more negative: in both of the last two March's, the market has had a false upside breakout, followed by a rather nasty decline in April. Last year, the size of the false breakout was about 20 SPX points, If a similar setup begins to take place this year, it should be heeded. That is, if SPX drops back below 1290, say, the entire picture turns much more bearish. Not only would that be another in a long series of false breakouts this year -- both upside and downside -- but it would augur for at least a retest of the lower end of this year's trading range.
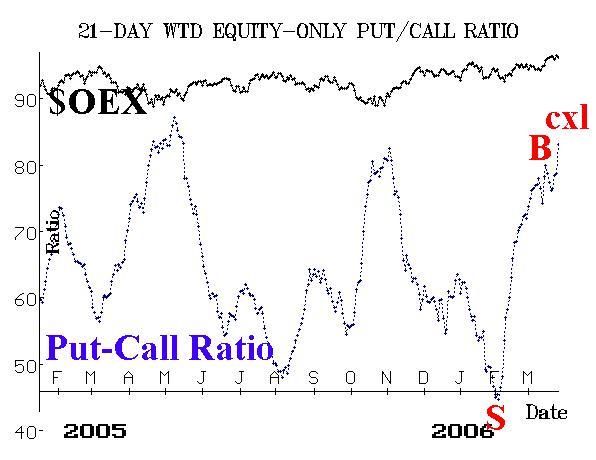
Meanwhile, the equity-only put-call ratios have canceled their recent buy signals. Today (Thursday, March 23rd), they both made new highs, which means that what had appeared to be buy signals (i.e., tops on the charts) last week now been exceeded. So, the whole buy signal will have to be reset again. Meanwhile, that returns them to sell signals.

Breadth just bounces back and forth with the institutional order flow. If the market's down, breadth is terrible. If the market's up, breadth it is tremendous. No rhyme or reason, other than that. The only day where that didn't seem to be true was today (Thursday), as the market was down nearly all day, but breadth was relatively flat. In any case, breadth just isn't a decent indicator right now, so don't worry that much about it.

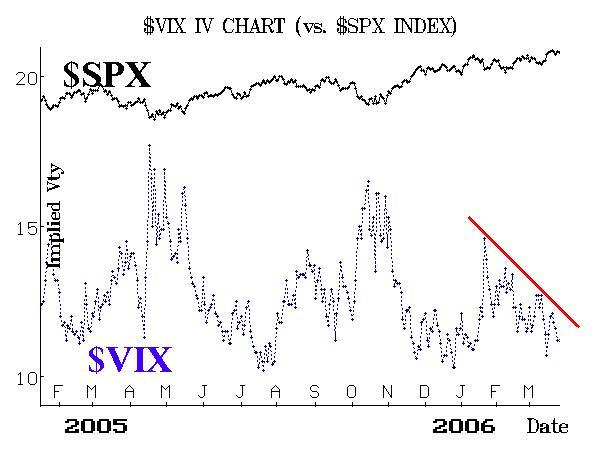
Finally, volatility indices (VIX and VXO) remain quite bullish. Even on days when the market has declined, they have declined as well. That's very unusual -- especially on Tuesday, when the market took a pretty good hit during a major intraday reversal. Hence, no one is panicking -- especially smart money. So, this may mean that there's just going to be more of this mindless back and forth action, without much of a trend.
In summary, these indicators are mixed, but so is the market. As long as SPX holds above 1295, the bulls are still in charge. But any slippage back below 1290 brings several recent negative precedents to bear, and things could get ugly quickly.
Lawrence G. McMillan is the author of two best selling books on options, including Options as a Strategic Investment, recognized as essential resources for any serious option trader's library. Sign up today and take an extra 10% off tuition for Larry's 2-Day Intensive Options Seminar on May 20 & 21 in Houston.