NASDAQ Commentary
Despite the 12.67 point gain on Friday, the NASDAQ Composite only managed a 6.34 point (+0.27%) gain for the week. It closed at 2312.82, which was above all the key moving averages. However, it's just shy of the new 52-week high level that has been a sore spot for a few weeks now. That mark is at 2333, and we've brushed it a couple of times since January. That remains our ultimate bullish line in the sand.
There's really not a lot to add about the composite. Support has been at 2240 since January, just like resistance at 2333. We've been waiting for a move - any move - outside that box to signal the beginning of a real trend. And, we're still waiting. As it appears now, the support we recently saw at the 10 and 20 day lines would suggest that the chart is more likely to move higher than lower, but that support has been inconsistent all year long. We'd still recommend waiting for a breakout move if you're looking for a bigger-point trade.
NASDAQ Chart

S&P 500 Commentary
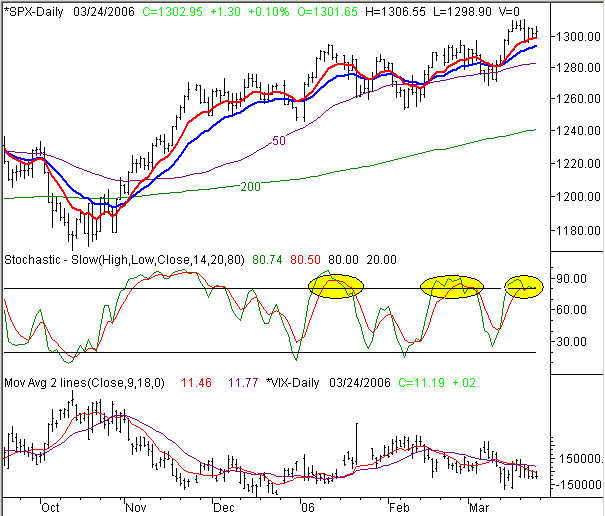
The S&P 500 squeeked out a 1.3 point gain on Friday to end the week at 1302.95. However, it still took a 4.3 point loss from the previous Friday (-0.33%). It was the only index to take a loss for the week, although the other two indices weren't exactly through the roof. However, we still saw a new 52-week high, and we still saw support at the short-term averages. So, the bulls are still winning most of the battles, even if in lackluster fashion.
On the other hand, we failed to see any follow through on the new highs hit late two weeks ago and early last week. True, the 10 day line acted as support during the most recent dip, but that support has been tested for three days straight now. Plus, we're stochastically overbought now. Sometimes that can be bullish, but as we saw in early January and mid-February, that can also be an ideal time to take some profits. That's one of the key worries we see right now.
What's most interesting here, though, is the VIX. Over the past week, we've seen a series of lower highs, steered mostly by the falling 10 day average. At the same time, we've seen the VIX make the same basic low for the entire week (11.17 or 11.11). In terms of a trend, the falling VIX is technically bullish for stocks. However, we also recognize that everything has a limit. We've seen the VIX lower than this, so it could certainly continue to head downward while stocks rise. However, we've also seen the VIX turn on a dime several times this year. With it hovering as low as it is right now (and not leaving a lot more room for that downward trend), the VIX is a bit dubious as a bullish indicator. That's the other key worry we see for the bulls right now.
S&P 500 Chart

Dow Jones Industrial Average Commentary
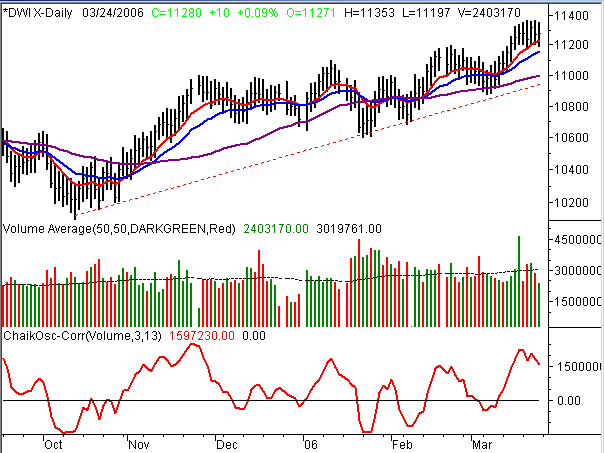
The Dow's 10 point gain on Friday was only a relative drop in the bucket (+0.1%), but still left the blue chip index at 11,280. For the week, though, the Dow registered a big goose egg.....nothing gained or lost. We did see a higher high and higher low though. In fact, the high of 11,364 (Tuesday) was a new multi-year high. The problem was, there was just no follow through.
Why no follow through? Well, as trite as it is to say 'not enough buyers', that really is the answer. The Chaikin line rolled over early last week following a super-surge in buying volume on the Friday before that. That was an idea we examined in the MidWeek Update, where a major top was marked by a blast of bullish volume that sucked out all of the buyers on one shot, leaving nobody behind but the sellers and profit-takers. Well so far, that seems to be the case with the fourth instance we've seen in the last twelve months.
In any case, the likely landing spot for any dip is ultimately going to be around 11,000. That's where the 50 day line is now, and that's where a major support line (dashed) is going to be soon. As for resistance, the only thing that we'll get us thinking like bulls again is a break above the recent 52-week high of 11.364.
Note that the 10 day line really isn't doing all that great of a job of holding as support.
Dow Jones Industrial Average Chart

Price Headley is the founder and chief analyst of BigTrends.com.