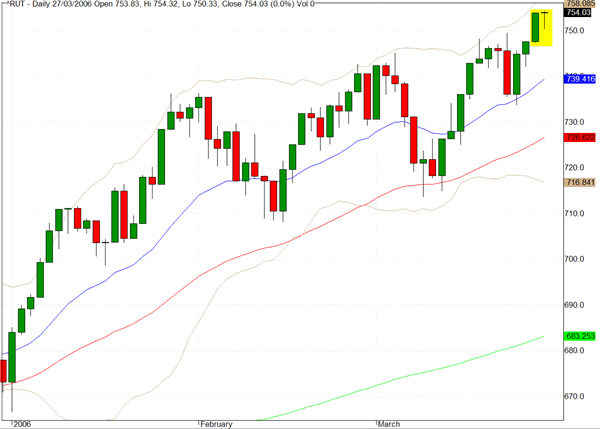
The indices marked time yesterday ahead of the FOMC meeting that takes place today. The S&P 500 slipped back marginally to 1301 and the DJIA declined by 0.3% to close at 11,250. The Russell 2000 recorded a quiet session but managed to eke out another all time high as it closed just above 754 and fractionally higher than last Friday's close.
As the candlestick formation, a Doji Hammer, reveals the index closed more or less on its high for the day which suggests a confident posture as we head toward the FOMC decision.
The Nasdaq 100 (^NDX) closed above 1680 for a very slight gain on Friday's close. In reviewing the daily charts of some of the constituent stocks we are seeing some positive volume characteristics and the index itself appears to be preparing for another attempt to take on the top of its recent range.
Just how much capacity there is for surprise in today's interest rate decision is hard to read but since it is the first meeting not to be chaired by Alan Greenspan in eighteen years there is always the possibility of some fireworks if the linguistic nuances are decoded in an adverse manner.

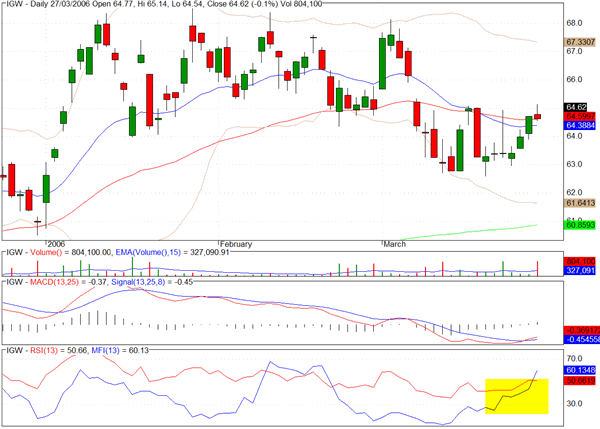
The iShares exchange traded fund for the semiconductor sector, IGW, is showing positive signs and could be ready to rally. We normally review the alternative sector fund, SMH, but this time the IGW chart seems to have clearer evidence of positive divergences. Within the sector some of the individual names we are watching include KLAC, MU, and ALTR.
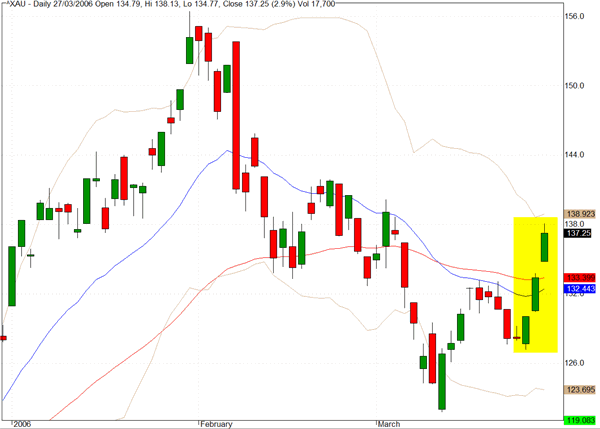
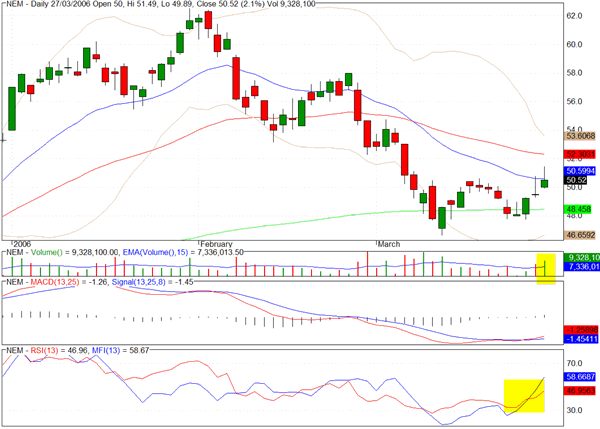
The Gold and Silver index (^XAU) has registered two consecutive upward island gaps and while it could run into resistance just above yesterday's close there is evidence of accumulation within the sector. Pan American Silver, PAAS, has broken out above its recent trading range and Newmont Mining also looks poised to move higher following weakness throughout February and most of March.
TRADE OPPORTUNITIES/SETUPS FOR TUESDAY MARCH 28, 2006
The patterns identified below should be considered as indicative of eventual price direction in forthcoming trading sessions. None of these setups should be seen as specifically opportune for the current trading session.
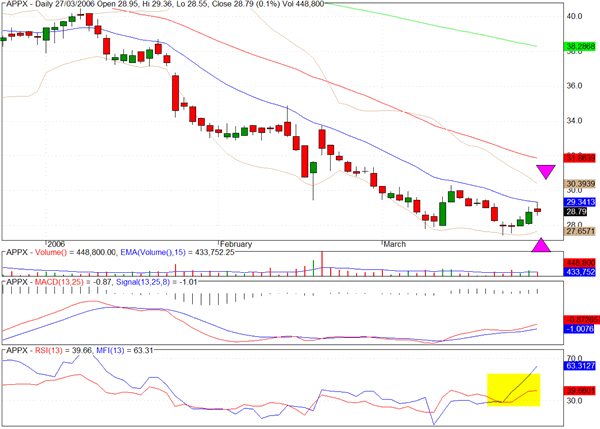
American Pharmaceutical Partners (APPX) is showing unusually positive money flow within a narrow volatility range. This is often the harbinger for a decisive breakout.
As discussed above Newmont Mining seems to have successfully rebounded from its 200 day EMA and there is evidence that the tide has turned since the selling began in early February.
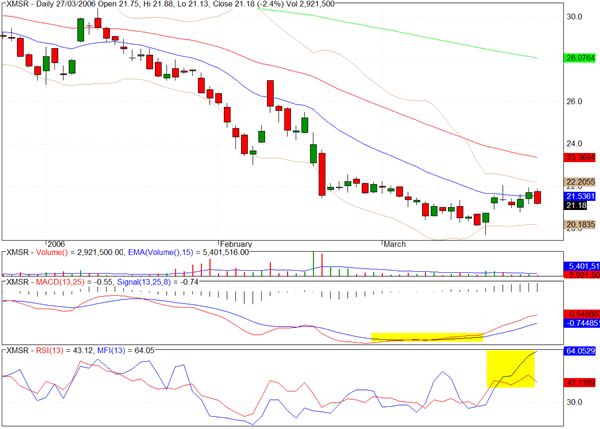
XM Satellite Radio could also be on the verge of a breakout as the volatility range is very constricted and the money flow is abnormally positive.
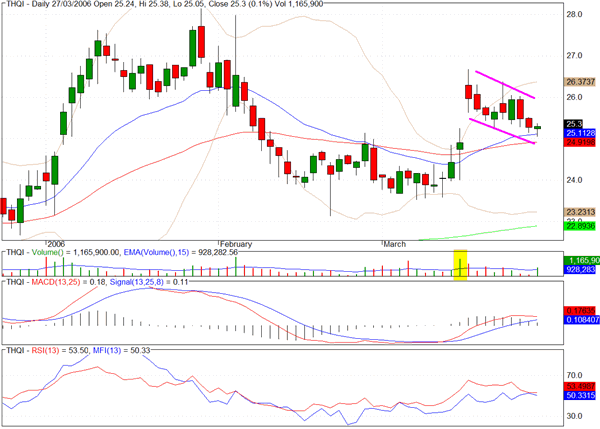
THQI has been in our portfolio for a few sessions on the long side and today could be the decisive day after yesterday's better than average volume at the intersection of two EMA's.
Clive Corcoran is the publisher of TradeWithForm.com, which provides daily analysis and commentary on the US stock market. He specializes in market neutral investing and and is currently working on a book about the benefits of trading with long/short strategies, which is scheduled for publication later this year.
Disclaimer
The purpose of this article is to offer you the chance to review the trading methodology, risk reduction strategies and portfolio construction techniques described at tradewithform.com. There is no guarantee that the trading strategies advocated will be profitable. Moreover, there is a risk that following these strategies will lead to loss of capital. Past results are no guarante of future results. Trading stocks and CFD's can yield large rewards, but also has large potential risks. Trading with leverage can be especially risky. You should be fully aware of the risks of trading in the capital markets. You are strongly advised not to trade with capital you cannot afford to lose. This article is neither a solicitation nor an offer to buy or sell securities.