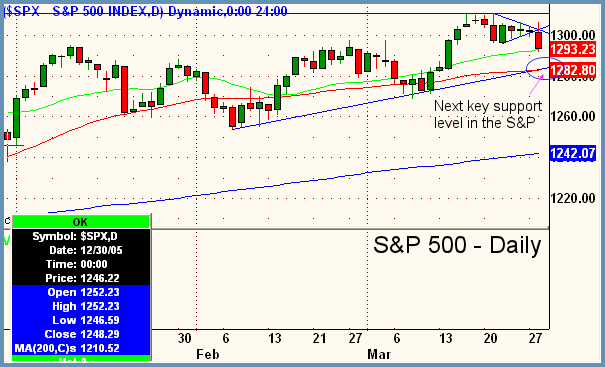
Good Morning, Traders. Uncle Ben maintained the course and offered no kind words for the bulls who were hoping for "one and done". Rates were raised another quarter point and no indication was given that we would freeze at this point without another raise at the May meeting. Markets responded with heavy selling that took the Dow down 95.57, the S&P 500 8.38, and the Nasdaq Composite 11.12. But how bad was it? Whenever we get a major catalyst like a Fed meeting to shake things up, its an excellent opportunity for armchair analysts to look at market internals at the close and also to examine where the selloff left the markets in relation to trendlines and prior swing highs and lows. So without further ado, lets get into it. Internals were not all that bad at the close. Breadth at 2.51 to 1 negative (NYSE) and 1.51 to 1 negative (Nasdaq) is nothing to run screaming for the hills about. Similarly advance decline lines closed on both exchanges -959 and -651 respectively, both firmly negative but neither in the super bearish areas of sub -1000. Technically, things are still intact as well. The daily chart of the S&P above shows us clearly breaking to the downside from the volatility contraction of the last few days, but note that we are still above all three major moving averages (20, 50, 200--green, red, blue) and more importantly the lower trendline which has been supporting since early February is still intact. Unless this line is violated, its still status quo, which is to favor the long side in strong stocks that are breaking out into clear territory (new 52 week or all-time highs) from solid bases. Overall bias remains upwards with near-term bias switching to sideways to down now. We say this because although the 20 ma is supporting just below price action in the benchmark index here, moving averages tend to be rather elastic in the major averages. Prices generally vascillate on either side of the 20 and trendlines are the real determinant of pivot points. The key support at 1282 as annotated also corresponds perfecly with the 50ma (red). If some followthrough selling ensues over the next few sessions, then this would be a likely target for the market to move to at which juncture we would reassess trend.
Peter Reznicek is the Chief Equity Strategist and a principal of the Prana Fund, a domestic hedge fund, and ShadowTrader, a subsidiary of thinkorswim which provides coaching and education to its clients on both intraday and swing trading of equities. For a free trial to the full version of The Big Picture or to learn about ShadowTrader's other services, visit shadowtrader.net or send an email to preznicek@shadowtrader.net.