NASDAQ Commentary
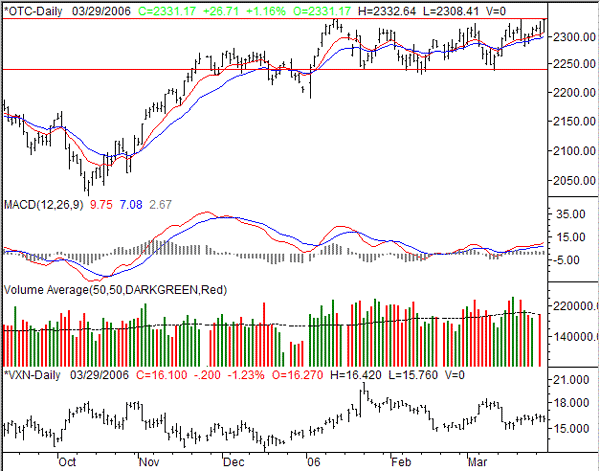
Here we go again. The NASDAQ's high of 2332.64 today is knocking on the door of that major resistance at 2333. Maybe this time it will actually manage to break through that barrier, but until it does, we're still skeptical. Fortunately, we're only a couple of points away from there, so we won't have to wait too long to get an answer. We'd say wait for a coupe of closes above 2333 before getting fully bullish, knowing that the market has been prone to fake-outs lately.
What may make this effort a little bit different than the last two attempts to cross 2333 is the support we see at the 10 and 20 day moving average lines. With that difference, we also see a milder, well-paced attack on 2333. The peak on January 11th was the result of a short-lived melt-up, so some profit-taking was very likely in the midst of that situation. However. the retest from the 21st of this month as well as today aren't on the heels of white-hot gains. This rally may be a little more sustainable.
That said, we still wouldn't buy-in until it was clear that 2333 had been hurdled.
NASDAQ Chart

S&P 500 Commentary
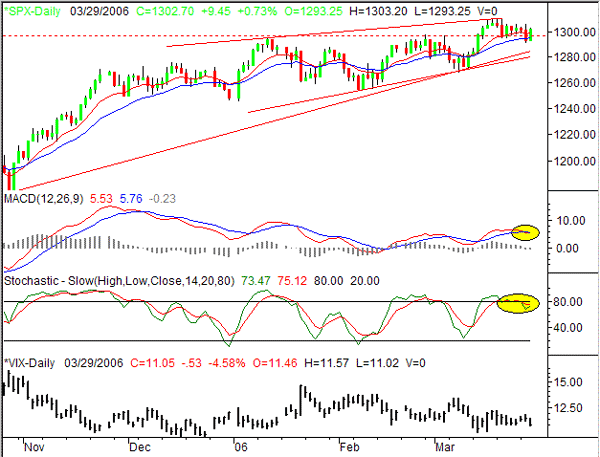
The SPX is up nicely today, which conflicts with most of the technical indicators on our chart. Yesterday, after the eight point dip, we completed a bearish MACD crossunder, as well as confirmed a stochastic sell signal. How did stocks respond today? With a big fat rally. The S&P 500 is up 9.45 points so far (+0.73%). The index is back to break-even for the week.
So what do we make of it? Good question. In the bigger picture, we're still bullish. Despite the ebb and flow that we've gotten so used to, higher highs and higher lows means there are more buyers than sellers. We've just gotten seasick getting from there to here. In the meantime, we've grown accustomed to seeing dips of about 25 points or so each time a new high was hit. In fact, that's what we were counting on when we reached 1310 a couple of weeks ago. So far, though, the buyers have been persistent, and we haven't gotten much of a correction at all. In fact, the 20 day line was support yesterday, and a springboard for today.
The problem is, we still have a MACD and stochastic sell signal. And the VIX is back down to unheard of levels (although we've gotten a little used to those low VIX readings by now as well). That's a huge vulnerability, which is why we're still a little fearful of getting too bullish here, despite what we see today.
If both of the sell signals are reversed AND the S&P 500 starts to make higher highs again, then we'd be able to justify going fully bullish. Anything else, and we have play the waiting game. Only a dip and close under the 20 day average would get us on the bearish side of things.
S&P 500 Chart

Dow Jones Industrial Average Commentary
Despite the Dow's 60 point gain today, the Dow Industrial Average is still having a little trouble getting back above the 10 day line. This trouble follows the Dow's own stochastic and MACD sell signals. While it's tough to take things at face value sometimes, that's what we're going to do here. The Dow - at best - has slipped back into its role of laggard. At worst, it may be gearing up for a bigger downward move.
If we do indeed get that mild correction, look for the Dow to reach as low as 11,100. That's where the 50 day line and a long-term support line would be by the time we saw the blue chips get that low. As for resistance, that still remains at 11,364 - the new 52-week high we reached just a few days ago. We don't want to look any further than that for the time being. The marekt has been back and forth for weeks now, and no move has really lasted more than a few days. We expect to see a longer and bigger move in the very near future, but we definitely need to see a break outside of these lines before making that call.
Dow Jones Industrial Average Chart

Price Headley is the founder and chief analyst of BigTrends.com.