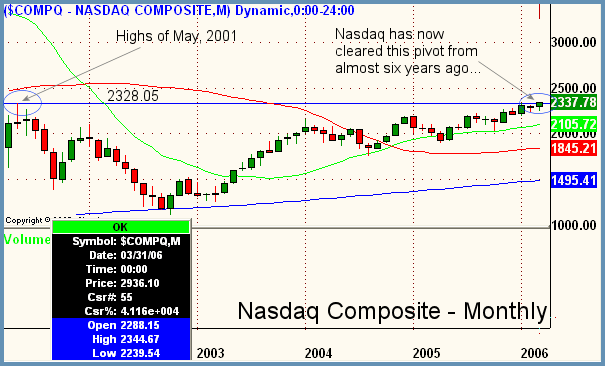
Good Morning, Traders. In yesterday's commentary we were questioning just how negative the selloff really was in the knee-jerk fed reaction of Tuesdays's trade. Apparently our analysis that it wasn't that bad was pretty on the money as the market roared back into shape on Wednesday and took back the losses and in the case of the Nasdaq Composite, then some. For some time now we have been commenting on the Nasdaq as being an Achilles heel of sorts to the other market averages. That dubious distinction is now behind it as the tech index pushed to new highs for the year and also to levels not seen since February of 2001! Way to go, Nasdaq. The head and shoulders pattern in the Nasdaq 100 that might have been a damper on the Nasdaq's rise is now invalidated as we staged a close in the $NDX over 1700 which as we discussed in prior columns was the breakpoint to invalidate that bearish pattern. All systems go for now as far as to the upside with all three major averages now "in sync". We have put the Nasdaq on a monthly chart above to show clearly how far we have run and the fact that our target of 2328.05 has been met. This was the pivot point from May of 2001 as annotated above. Where to from here, cautiously upwards. Although some correctional activity is obviously going to come in to the markets in due time, the fact that all three are now at highs for the year is certainly positive. Yesterday's commentary illustrated that the Fed selloff was not really on overly bearish internals which is what made us poo poo the selloff as not that notable. In direct contrast, yesterdays strength was characerized by very strong market internals. Breadth on the NYSE closed almost 4 to 1 positive, and on the Nasdaq which clearly had the upper hand, advancing volume outpaced declining volume at the close by better than 6 to 1!!!! That is very strong and indicative of good, across the board buying. Advance decline lines were also in great shape at the bell with 1534 more advancers than decliners on the NYSE and 1373 on the Nasdaq. Remember that the Fed selloff resulted in advance decline lines at the close that were greater than minus 1000. Things are looking up.

Peter Reznicek is the Chief Equity Strategist and a principal of the Prana Fund, a domestic hedge fund, and ShadowTrader, a subsidiary of thinkorswim which provides coaching and education to its clients on both intraday and swing trading of equities. For a free trial to the full version of The Big Picture or to learn about ShadowTrader's other services, visit shadowtrader.net or send an email to preznicek@shadowtrader.net.