Divergent performances amongst the indices was once again one of the main themes from yesterday. The DJIA fell back by 0.6% from Wednesday's gains whereas the Nasdaq 100 gained 0,3% and the Nasdaq Composite finished a volatile day more or less where it had started but after probing new multi-year higher levels.
The daily chart of the S&P 500 reveals quite clearly the resistance that is apparent at the 1310 level and also highlights the long upper tail formation that can be seen on most of the indices' charts. Today marks the end of the first quarter and some further portfolio re-engineering is to be expected which could see some interesting cross currents between the cash and futures markets.

We have featured charts from the Treasury market this week in the wake of the FOMC meeting earlier in the week. Yields have continued to climb since Tuesday's announcement and as the chart on the Ten Year note shows the yields now seem headed to the 5% level. If this represents an intermediate plateau level for yields the equity markets may not be radically unsettled by such yield creep, but, if we were to keep heading higher above the five percent level, this could create a more troubling environment for stocks.

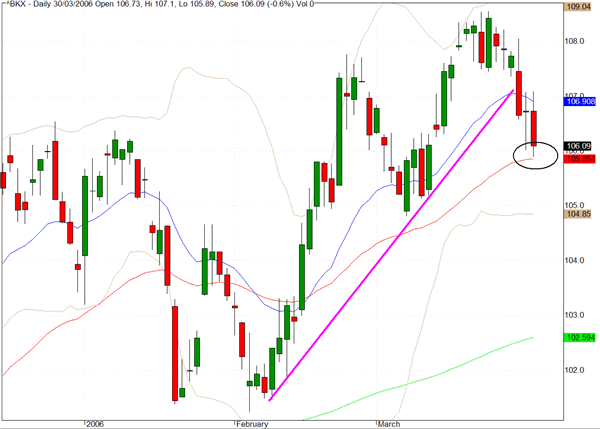
In mid-March the banking sector broke out above its trading range but since then we have erased all of this progress and more. A case could be made that the break below the trendline, through the recent lows that we have drawn, now sets up the possibility that this breakout is invalidated which would gain further plausibility if we fail to hold above the 50 day EMA.

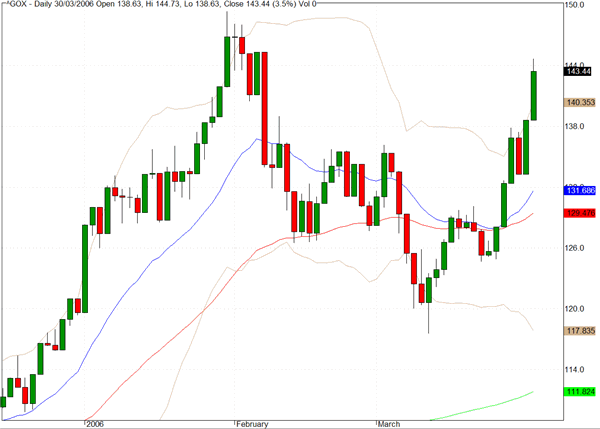
The Gold Index (^GOX) has rallied strongly over the last several sessions and the price of the metal itself broke yesterday to a new multi year high above $580. Our long position in Newmont Mining, which we added on Tuesday, realized our profit target and we closed the position on the close yesterday with a 7% gain.
Our online portfolio enjoyed some solid gains yesterday in XMSR, TSM, SFNT, HGSI and AMZN.

TRADE OPPORTUNITIES/SETUPS FOR FRIDAY MARCH 31, 2006
None today.
Clive Corcoran is the publisher of TradeWithForm.com, which provides daily analysis and commentary on the US stock market. He specializes in market neutral investing and and is currently working on a book about the benefits of trading with long/short strategies, which is scheduled for publication later this year.
Disclaimer
The purpose of this article is to offer you the chance to review the trading methodology, risk reduction strategies and portfolio construction techniques described at tradewithform.com. There is no guarantee that the trading strategies advocated will be profitable. Moreover, there is a risk that following these strategies will lead to loss of capital. Past results are no guarante of future results. Trading stocks and CFD's can yield large rewards, but also has large potential risks. Trading with leverage can be especially risky. You should be fully aware of the risks of trading in the capital markets. You are strongly advised not to trade with capital you cannot afford to lose. This article is neither a solicitation nor an offer to buy or sell securities.