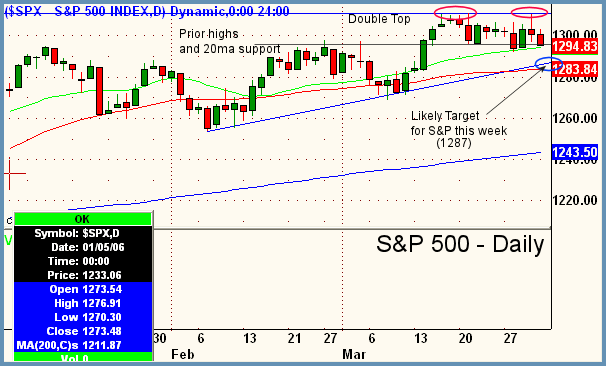
Good Morning, Traders. In the snapshot, we are looking at some pretty strong odds that the S&P 500 comes in a bit this week to the 1287 area where its 50 period daily moving average is currently residing. On Thursday of last week, we missed testing the 2006 highs in the benchmark index by only a third of one point. Subsequent to this failed test, the market backed off and closed negatively that day which was followed by Friday's selloff that closed at the lows. Currently at the 1294 area, note that we do have 20ma (green) and prior high support in the bull's favor, however in the hierarchy of technical indicators, trendlines are simply more powerful than moving averages. In fact moving averages are only meaningful areas of support or resistance if there is some technical pattern to the left of current prices that would imply a pivot in that area. We have that this week with the 20ma residing at prior highs, however, the trendline (blue) which defines bias at this point is simply more powerful and prices will eventually meet it. The recent failure at the prior 2006 highs (red circled areas) greatly increases these odds, currently. So, we'll be looking for a minor pullback in this market in the coming week, more than likely to the 1287 area (blue circle). At that point we will have to reassess market direction as we come in to the 50ma (red) which has been support during the last two months and is trending upwards at this point. Overall bias remains upward, with near-term bias sideways to down.

Focus List

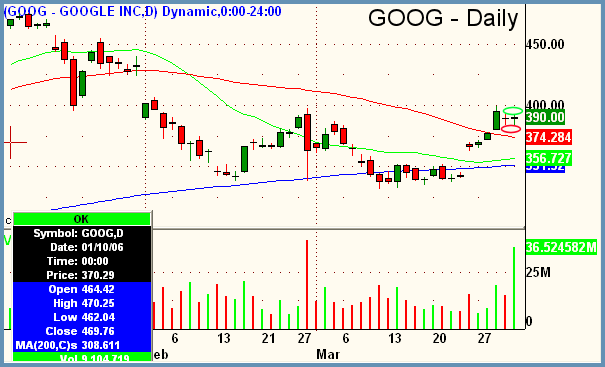
GOOG - Google Incorporated
Industry - Internet (Search)
Side - Long
Trigger - 394.05
Stop - 383.11
Target - 423.19
Timeframe - 3 weeks to multi-week
Notes
- Target is to fill gap between 1/31 and 2/1 earlier in the year
- Clients ask about this stock constantly and generally our stance is that its ambiguous here, but if its going to be long then two dojis in a row are the highest odds of a move above the dojis being sustained
- Hard stop under lows of previous two trading days
- And yes...thats an 11 point stop, so use appropriate size if you are going to tangle with this beast
- Advanced traders only
Peter Reznicek is the Chief Equity Strategist and a principal of the Prana Fund, a domestic hedge fund, and ShadowTrader, a subsidiary of thinkorswim which provides coaching and education to its clients on both intraday and swing trading of equities. For a free trial to the full version of The Big Picture or to learn about ShadowTrader's other services, visit shadowtrader.net or send an email to preznicek@shadowtrader.net.
Disclaimer
The risk of loss in the trading of any securities products can be substantial. The strategies employed here are active trading strategies therefore you should carefully consider whether such trading is suitable for you in light of your personal investment objectives and financial resources.