Amongst the broad indices, the Russell 2000 was the outstanding performer during the first quarter with a gain of 13.5% since the close on December 31st 2005. The index even managed to gain a little ground on Friday, unlike most of the other indices, to close at 765 for another all-time high.
In reviewing individual sectors the Gold Index (^GOX) which has been moving up strongly over the last few sessions recorded a 19% gain for the quarter, the Broker/Dealer sector (^XBD) moved up almost 17% and the Dow Jones Industrials gained 3.6%. One of the few negative sectors was the Dow Jones Utilites which moved down by 4%. The yield on the Ten Year Note gained 45 basis points, a little more than 10% during the quarter, and closed on Friday at 4.85%.

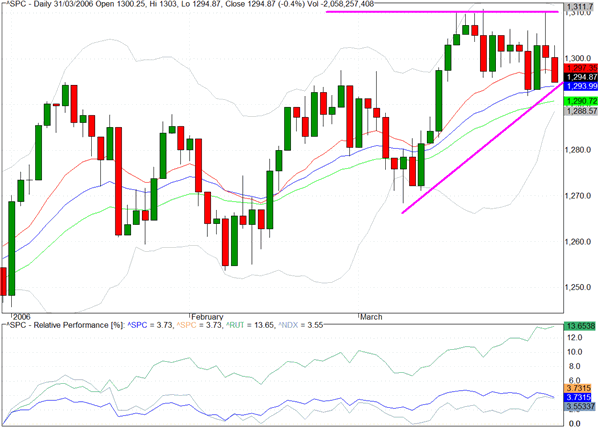
The daily chart for the S&P 500 highlights the overhead resistance at the 1310 level that has confined trading over the last couple of weeks. During the last few sessions when asset managers were preoccupied with portfolio cosmetics we have drifted down toward the rising trendline through the lows and all three moving averages are converging around the 1295 level.
As we noted last week it would be prudent to keep an eye on Treasury yields this week as they approach the 5% level on the five and ten year maturities. If we plateau there we would retain our positive intermediate outlook for equities.
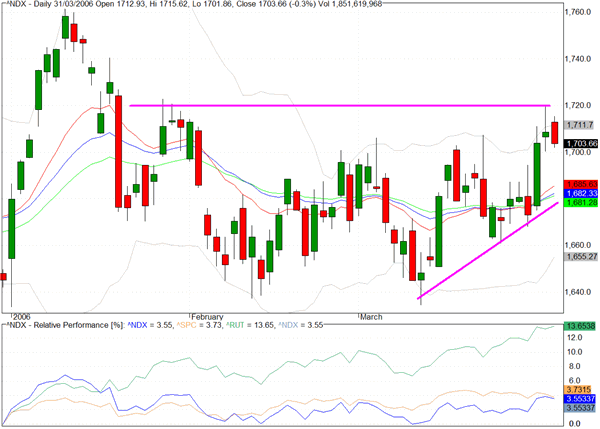
In reviewing the Nasdaq 100 (^NDX), the relative performance chart segment shows that we finished the quarter with a 3.5% return which was pretty much in line with the S&P 500 gain of 3.7%. The index started the year strongly but has meandered since the beginning of February. There is clear resistance between 1710 and 1720 which needs to be taken out before we can retest the January highs.
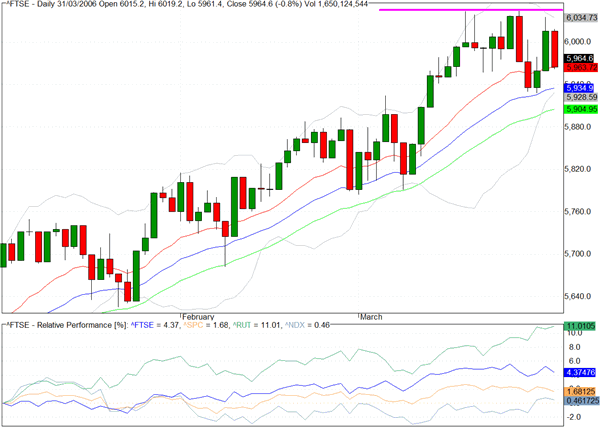
The FTSE 100 index is showing signs of increasing volatility as it attempts to break decisively above the 6000 level. The index managed a 4.3% gain for the quarter but Friday's decline of 0.8% and back to back reversal candles also coincides with a succession of lower highs.
TRADE OPPORTUNITIES/SETUPS FOR MONDAY APRIL 3, 2006
The patterns identified below should be considered as indicative of eventual price direction in forthcoming trading sessions. None of these setups should be seen as specifically opportune for the current trading session.
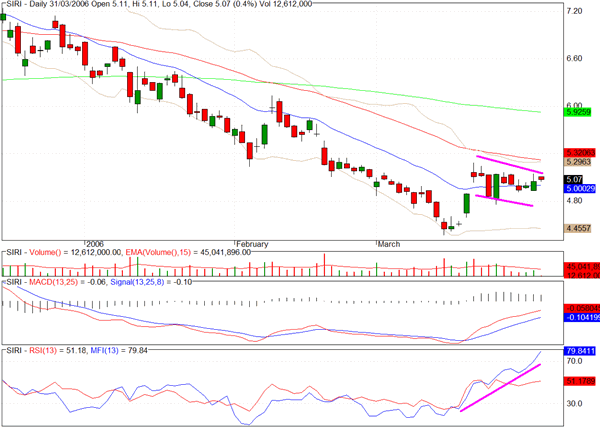
Sirius Sattellite Radio (SIRI) has very positive money flow and a bullish flag formation and could be poised for a breakout.
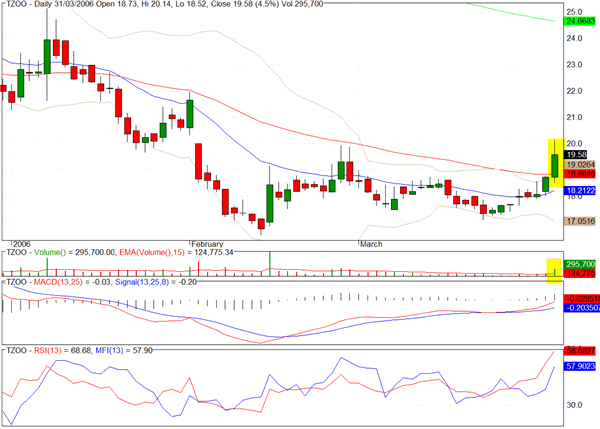
Travelzoo (TZOO) moved above its 50 day EMA and through its 50 day volatility band on heavy volume on Friday.
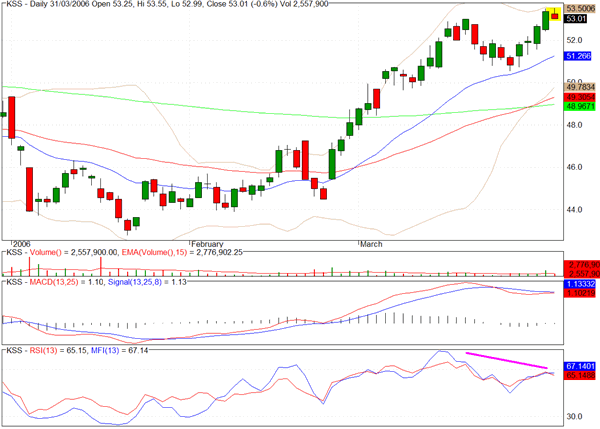
Kohl's Corp (KSS) is showing negative divergences in what might be the first signs of an intermediate topping pattern.
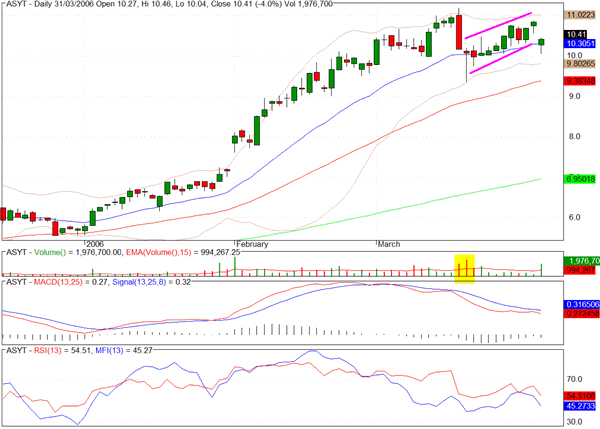
ASYT looks vulnerable as it has emerged from an ascending channel following the mid March drop on heavy volume.
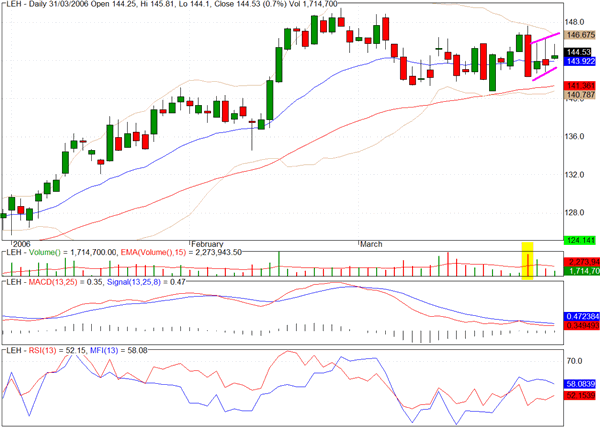
Lehman Brothers (LEH) has an early stage bear flag formation.
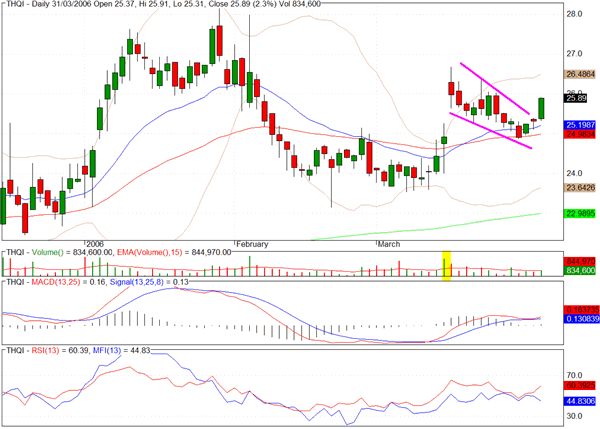
THQI appears to be starting an ascent from the bullish channel formation.
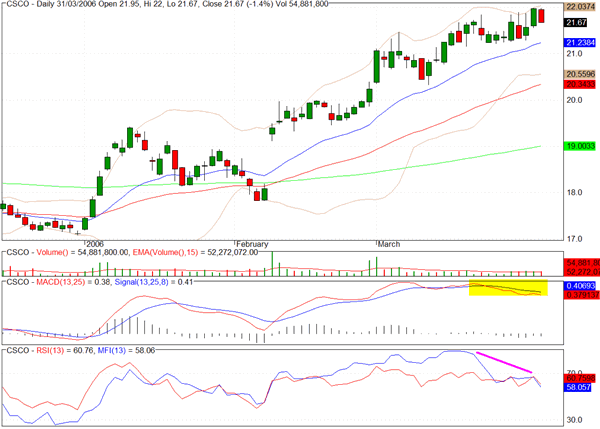
Cisco Systems (CSCO) is also showing some signs of negative divergence but we would rather monitor the stock over the next few sessions before making a recommendation.
Clive Corcoran is the publisher of TradeWithForm.com, which provides daily analysis and commentary on the US stock market. He specializes in market neutral investing and and is currently working on a book about the benefits of trading with long/short strategies, which is scheduled for publication later this year.
Disclaimer
The purpose of this article is to offer you the chance to review the trading methodology, risk reduction strategies and portfolio construction techniques described at tradewithform.com. There is no guarantee that the trading strategies advocated will be profitable. Moreover, there is a risk that following these strategies will lead to loss of capital. Past results are no guarante of future results. Trading stocks and CFD's can yield large rewards, but also has large potential risks. Trading with leverage can be especially risky. You should be fully aware of the risks of trading in the capital markets. You are strongly advised not to trade with capital you cannot afford to lose. This article is neither a solicitation nor an offer to buy or sell securities.