Our sentiment indicators showed us excess optimism in the market last week, which switched our market posture to bearish on stocks for now. With the market making new multi-year highs in recent weeks, it's not surprising that the majority of investors and traders have confirming an increase in their hopes for a continued market rally. But it's been my experience that when the vast majority is most convinced that the market will rally, that's the time when you need to watch out for a downside surprise. The two indicators that I rely on the most to spot these sentiment extremes are the CBOE Equity Put/Call ratio and the Volatility Index (VIX).
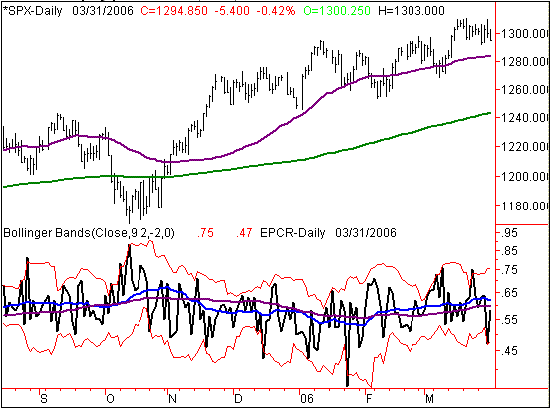
One question I've been getting a lot recently is why our equity put/call numbers we report to subscribers nightly do not match up with the put/call numbers found at www.cboe.com (in the Market Statistics section). The difference is that I prefer to look only at the CBOE EQUITY put/call ratio, which looks only at the options traded on stocks. The total put/call ratio reported at the CBOE includes index options. The problem with index options is that historically they do not test as well as a contrary indicator, as they are more often used as a hedging vehicle or used by institutional investors who are not as good of a contrary indicator as individual investors as a whole. I like to plot the CBOE equity put/call ratio against 9-day & 21-day (or about one month) Bollinger Bands, and then look for extremes above the upper band to show a potential peak in fear at important market bottoms while marking extremes in optimism below the lower band to mark significant tops. Currently we are coming off a spike in greed below the lower band last week, which turned us bearish on the major stock market averages.
Daily Chart of the CBOE Equity Put/Call Ratio
Long-time readers know that I also love to follow the CBOE Volatility Index (VIX) as a barometer of investor fear or complacency. I believe that when the VIX hits relatively high levels, options players are typically panicking. Their rush to buy puts as the market drops sends the volatility priced into put options surging, resulting in higher-than normal VIX readings. In contrast, when no one wants puts to insure their portfolios or to bet on the downside, the volatilities priced into these options tend to dwindle, showing a lack of worry about future downside risk. Historically that is just the time when you should be positioning for downside in the markets, as I pointed out in prior alerts in late-November 2002 as well as March 2002.
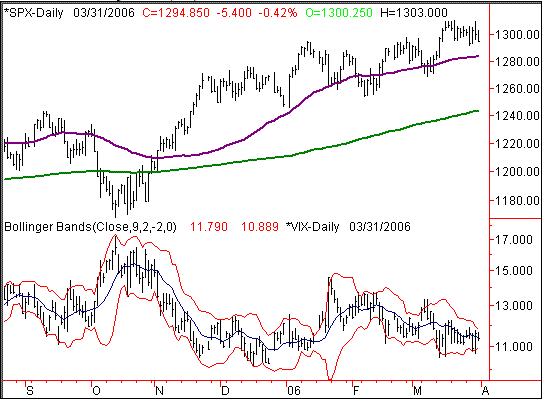
We are currently at another one of those junctures where most investors are showing a surprising lack of worry despite a rather uninspiring market. I analyze the VIX in this case based on 21-day and 9-day Bollinger Bands to measure what is a relatively low or relatively high volatility level. Using plus and minus two standard deviations, the VIX should typically trade within these bands roughly 95% of the time. So trading outside of these bands is relatively unusual, and often signals a turning point is near. As you can see from the daily chart of the VIX below compared to the S&P 500, the tags of the lower band on the VIX have been particularly good times to bet that a market top was in the making.
S&P 500 with VIX (daily)
This low VIX sell signal plus the complacency shown in the low equity put/call signal are only bad news for those who are unaware of it or have no way to profit from it. I expect there to be tremendous profit opportunities in bearish positions using short sales of stocks and especially using put options. If you are not set up to use one or more of these bearish vehicles, you owe it to yourself to learn more about how you can do better than cash in the coming market downturn.
Price Headley is the founder and chief analyst of BigTrends.com.