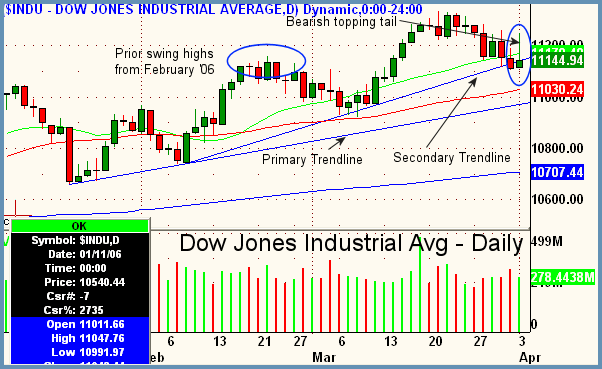
Good Morning, Traders. What started out as some strength on the first trading session of the month, turned sour later in the day and fell back into range, closing negative on the Nasdaq and erasing over 100 points of Dow intraday gain. Breadth closed divergent with positive readings on the NYSE and negative on the Nasdaq. All in all a day that started out on the good foot, moving well out of Friday's range and then fell apart late day, negating the entire morning gain.
In Monday's commentary we spoke of a possible continuation of retracement in the S&P to the 1287 area. Certainly after today that scenario looks more promising. Another reason why this may occur is the recent action in the Dow. The chart above is a daily Dow with trendlines drawn in. Notice how the secondary trendine looks as though it wants to break to the downside. Certainly, Monday's bearish candle should not be ignored. Its a long topping tail with shadow to the upside indicating that bulls pushed prices very high during the session and then being beaten back to where they started. This is bearish. Prior highs in the Dow which is the circled area in mid February need to hold here for the secondary trendline to not be violated. If we do lose this level, then the Dow should move freely downwards to the 11,000 level where the primary trendline is currently supporting. This would make sense as it presents a similar picture to the one we presented Monday morning in the S&P where a 50 period daily moving average (red) is residing below us right at a trendline support area. Let's see how it plays out. Overall bias remains upward with near-term bias sideways to down.

Peter Reznicek is the Chief Equity Strategist and a principal of the Prana Fund, a domestic hedge fund, and ShadowTrader, a subsidiary of thinkorswim which provides coaching and education to its clients on both intraday and swing trading of equities. For a free trial to the full version of The Big Picture or to learn about ShadowTrader's other services, visit shadowtrader.net or send an email to preznicek@shadowtrader.net.
Disclaimer
The risk of loss in the trading of any securities products can be substantial. The strategies employed here are active trading strategies therefore you should carefully consider whether such trading is suitable for you in light of your personal investment objectives and financial resources.