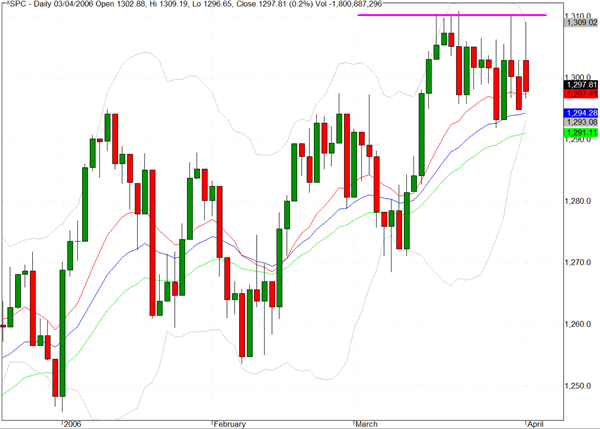
The indices began the first day of the new quarter on a positive note with all of the indices moving up toward the top of their recent trading ranges but as the day progressed there was a loss of momentum as it became clearer that there was insufficient resolve to take out the overhead resistance.
The S&P 500 cash index (^SPC) pushed up to the 1309 level, slightly below recent intraday highs, but then reversed to close at 1297 which was a slight gain on the day but near the lows for the day. The long upper tails that are visible on the chart over the last several sessions could suggest that we may seem some renewed vigor from short sellers who would like to test the conviction of the asset managers who have been accumulating steadily over the last few weeks.
The Nasaq 100 cash index (^NDX) actually moved yesterday to a two month intraday high of 1723 but retreated to close near its low for the day at 1706. Whether the bulls are ready to temporarily concede the agenda because of their inability yesterday to take out the overhead resistance may become clearer in today's trading

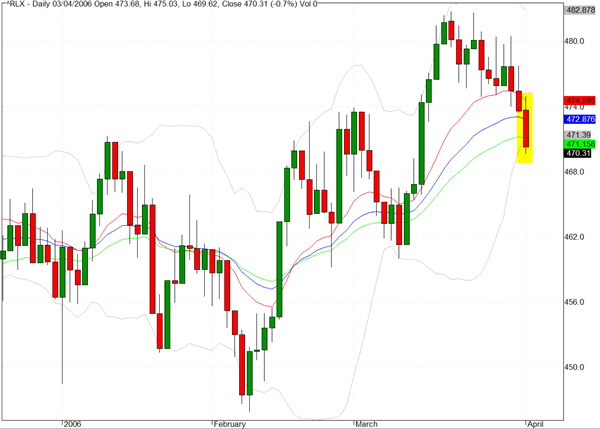
One of the weakest looking sector charts from our daily analysis is for the Retail Sector (^RLX). The index has been moving down for several sessions and closed yesterday below its 200 day EMA.
TRADE OPPORTUNITIES/SETUPS FOR TUESDAY APRIL 4, 2006
The patterns identified below should be considered as indicative of eventual price direction in forthcoming trading sessions. None of these setups should be seen as specifically opportune for the current trading session.
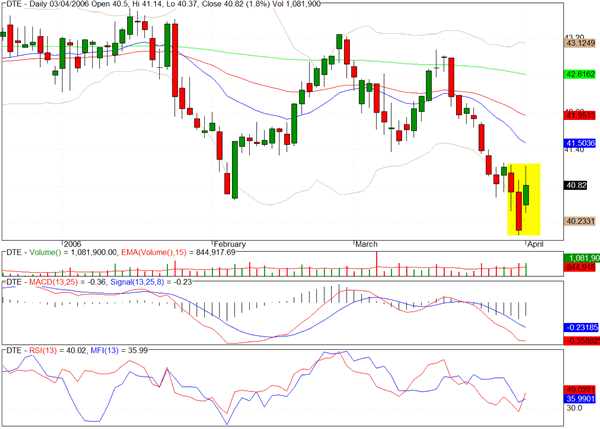
DTE Energy displays a well formed Morning Star formation and there is a possible double bottom formation.
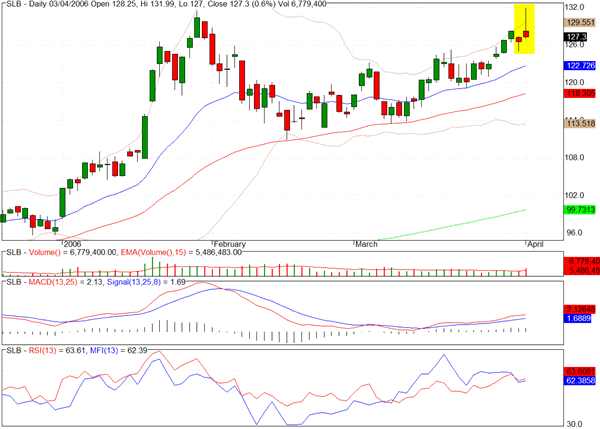
Schlumberger (SLB) registered a Shooting Star formation after touching the late January high of 132 and there is evidence of fading money flow.
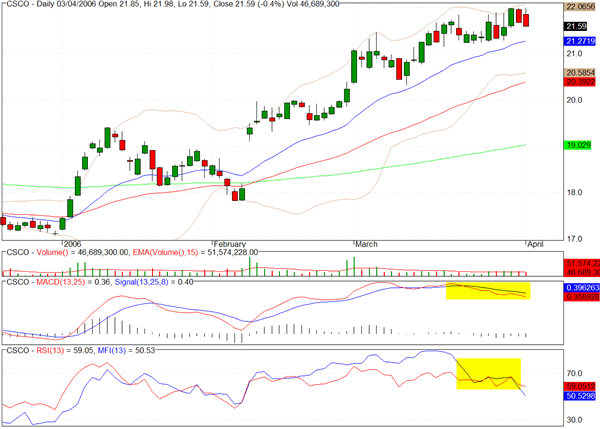
In yesterday's column we commented on the growing negative divergences on the chart for Cisco Systems and we would suggest that a short trade offers a favorable reward/risk proposition.
Clive Corcoran is the publisher of TradeWithForm.com, which provides daily analysis and commentary on the US stock market. He specializes in market neutral investing and and is currently working on a book about the benefits of trading with long/short strategies, which is scheduled for publication later this year.
Disclaimer
The purpose of this article is to offer you the chance to review the trading methodology, risk reduction strategies and portfolio construction techniques described at tradewithform.com. There is no guarantee that the trading strategies advocated will be profitable. Moreover, there is a risk that following these strategies will lead to loss of capital. Past results are no guarante of future results. Trading stocks and CFD's can yield large rewards, but also has large potential risks. Trading with leverage can be especially risky. You should be fully aware of the risks of trading in the capital markets. You are strongly advised not to trade with capital you cannot afford to lose. This article is neither a solicitation nor an offer to buy or sell securities.