NASDAQ Commentary
The NASDAQ Composite is holding near the flatline today, after challenging Monday's new high of 2357.53. Today's high of 2356.50 fell just a hair short of that, so odds are that there's some resistance there worth noting. We'll keep track of that line at 2357 for future updates.
As for now, the composite is trading at 2345.48, with a trading range slightly higher than yesterday's. For the week, the NASDAQ is up by 5.69 points (+0.24%), and still fighting to go higher.
Yet as we said in the Weekly Market Outlook, there's a lack of decisive bullishness that still leaves us skeptical of this mild strength. There have been no breakout days since then, volume has been far from bullish, and we're becoming even more stochastically overbought. That's a deck definitely stacked against the NASDAQ, but so far, the buyers have been persistent enough to fight off any dip.
As such, we still have to expect the NASDAQ Composite to head lower before heading higher again. Of course, we're on the verge of an important technical sell signal to support that stance. The Chaikin line (a volume-based momentum tool) is just about to fall under the zero line. When it does, the sell signal is complete, and it would only take a tiny loss to force that crossunder move. Is it a good signal? We always contend that volume shows the market's true nature, so yes, we take volume trends very seriously. Three Chaikin sell signals in the latter part of last year worked out very well, while the one in February didn't. Still, this is a major red flag. And even a simple look at breadth and depth verifies that this weak rally only has minimal support.
But, as we've grown used to, the NASDAQ is in a tight range. The newest one is between resistance at 2357, and the support at 2333 where lows have been made over the prior four sessions. If that 2333 line rings a bell, it's because resistance was there for a long time. Now that the hurdle has finally been crossed, the bulls are going to fight to hold that ground. Only a move outside of this new range would justify a trade. If the composite falls under 2333, we'll plan for a retest of the 50 day line at 2291, and maybe even lower once we get there. A break above 2357, however, does not include any clear target, as it's still new territory fpr all of us.
NASDAQ Chart

S&P 500 Commentary
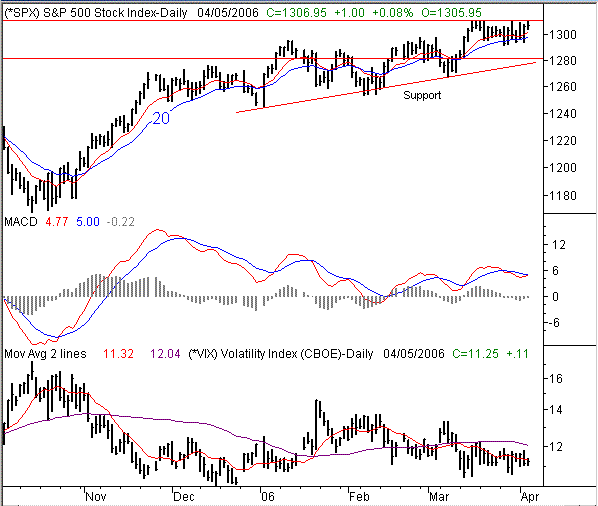
There are a few parallels between the NASDAQ and the S&P 500. Primarily, the S&P's strength today was just enough to verify resistance at 1310. The S&P 500 reached that new high on March 16th, and has actually hit that mark five times (including today) since then. Yet, it has yet to get past it. That clearly is the make-or-break point for the SPX chart.....only a close above 1310 would get us interested in being buyers.
For the day, the S&P is up only about a point, while for the week, it's up 12.10 points (+0.93%). That, however, is enough to leave this chart just a hair away from a significant MACD buy signal. Simultaneously, the VIX is still in a downtrend, as it meets resistance at its own 10 day moving average and is being pressured back into a stunning 10/12 range. That remains this chart's - and the market's - biggest liability.
Despite that, a look at the chart reveals a clear uptrend that dates back to October of last year. It was choppy and frustrating, but it's an uptrend all the same. So in that light, we have to give credit where credit is due. As traders say, the trend is your friend (until proven otherwise), so we remain generally bullish in the bigger picture. What exactly is that bigger picture. The support line framed by this year's low points is currently at 1277. The S&P 500 could fall all the way back to there, and still be in an intermediate-term uptrend.
In the meantime, that's pretty much what we expect to happen. The S&P 500 has just hit a little too much resistance at 1310 to ignore, and the VIX just shows a little too much complacency. And, if the SPX follows the NASDAQ's lead like it usually does, some of the problems the NASDAQ is facing now will be plaguing the SPX chart soon. As we mentioned, the only trump card to that outlook would be a move above 1310. At that point, euphoria could overcome reason, and the market could start another buying spree. But, given the time of year we're rolling into, that's the less likely scenario.
But don't misunderstand that - we wouldn't be 'bigger picture' bearish unless we saw the S&P 500 break under that key support line.
S&P 500 Chart

Dow Jones Industrial Average Commentary
Short and sweet here today....
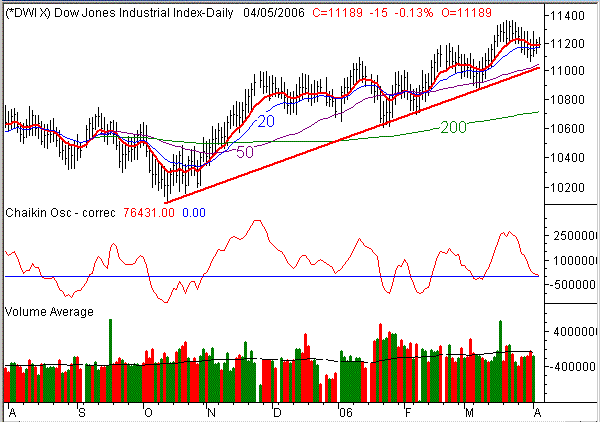
The Dow is still in its bigger trend, where it's been working its way higher for weeks. Although it's flat today (down 15 points), it's up by 80 points (+0.72%) for the week so far.
What's interesting is that the Dow is the only index that hasn't even come close to retesting its 52-week highs today. The Dow's high mark is at 11,360, where it topped out for several days in mid-March. You'll find support around 11,000, where not only the 50 day line is resting, but so is the support line that extends all the way back to October.
We remain neutral-to-bullish on the Dow, especially knowing that it's recently tended to do the opposite of what the rest of the market is doing.
Note, however, that the Dow's Chaikin line is also on the verge of a bearish cross under zero.
Dow Jones Industrial Average Chart

Price Headley is the founder and chief analyst of BigTrends.com.