A very common pattern that often shows up on stock charts is the triangle or wedge pattern. This occurs any time the price of a stock gets trapped into a narrowing trading range. If you are unfamiliar with what a trading range is, it is simply a group of relative highs or lows that a line can be drawn through to connect.
Lines that a stock moves higher off of are support lines while lines that a stock moves lower off of are resistance lines. These lines can either be parallel and horizontal, parallel and diagonal moving upward or downward or diagonal and intersecting. It is mainly that last group that we are going to look at today.

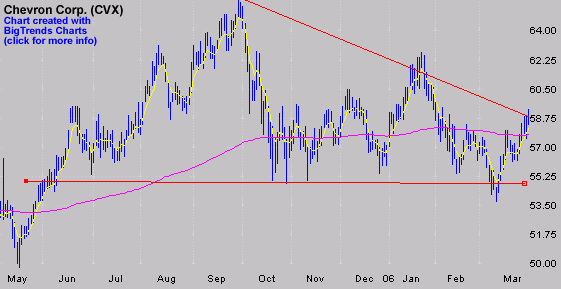
In the first chart you can see the performance of Chevron (CVX) for much of the last year. The bottom red line is the support line. You can see that once the price moved over that line in June of last year it has not been able to drop too far below it since. It has moved down to it or even just slightly past it, but has not been able to cross over. Similarly, with the resistance line, the top red line, the price has not been able to move above it.

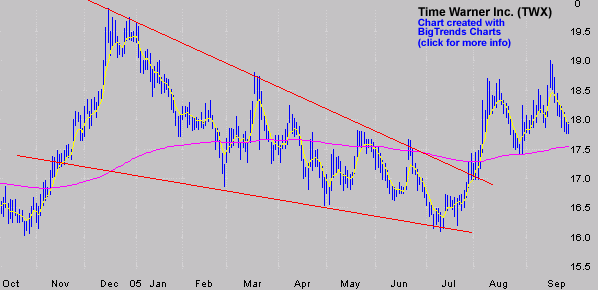
As you can see, the two lines are narrowing so that eventually the price will have to move outside of one of the lines. When this happens it is usually a sudden movement, such as the movement you can see in the second chart. Some traders use this opportunity to buy or sell, depending on whether it breaks through the support line or the resistance line, as it did in the second chart. It is hard to predict beforehand which side the stock will move to at the end of its range though. Triangles can be either continuation patterns, meaning that they occur as a pause in a much larger trend, or they can also be reversal points, where one trend is ending and another is starting.

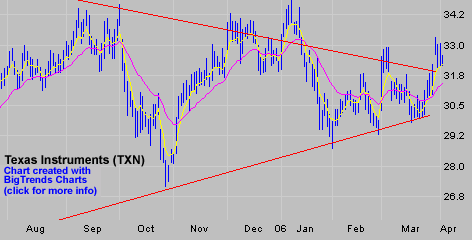
The next chart shows a stock that seems to just have confirmed a breakout. Texas Instruments (TXN) just the other day broke out above the upper line (resistance line) so it will most likely head higher for a couple weeks.
As you have probably noticed, watching chart patterns to make trades is highly subjective and not backed up by scientific testing. While many traders use these concepts to trade, we prefer to use methods that are carefully tested. However, it is a good idea for all traders to have an understanding of these and other chart patterns in order to have a diverse knowledge and understand of the stock market.
Price Headley is the founder and chief analyst of BigTrends.com.