NASDAQ Commentary
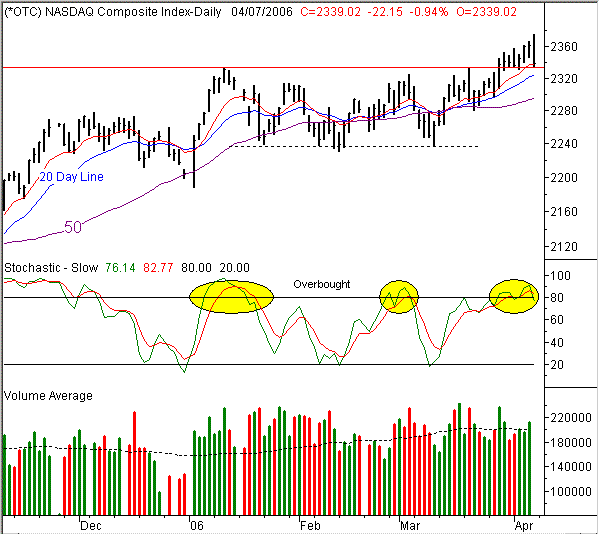
Everything was just fine for the bulls until Friday, when the NASDAQ Composite lost 22.15 points (-0.94%) to close at 2339.02. That meant a tiny loss for the week, of 0.77 points......we'll call it a breakeven. Interestingly, the big reversal came after the composite hit a new multi-year high of 2375.45 in the opening minutes of trading.
As for what's next, that close at 2339 was suspiciously close to the 10 day moving average line. In fact, it's right on top of it. So the question is one of whether or not the 10 day line will hold as support. Given the overall scenario and chart, we have to say that it's already proven itself as a support line, which suggests that the market is likely to stage a recovery after Friday's fiasco, and keep pushing into new-high territory.
While it didn't do such a great job of it early in the year, the 10 day average became the support line of choice with this latest runup. On March 24th, 29th, April 4th, and now the 7th (for the most part), the 10 day moving average (red) halted the NASDAQ's decline and prepped it for the next move higher. We're going to assume it will continue to do so until it clearly stops acting as support.
At the same time, we see something a little more ambiguous on the NASDAQ's chart. Between mid-January and late March, the composite was moving sideways, stuck in a range. The 10, 20, and 50 day lines were pretty well entwined, as the index went nowhere. But now, we could be seeing a case where the consolidation phase is over, and stocks are back on the move.
The problem with that scenario, however, is that the Dow and the S&P 500 didn't go through that same consolidation period. Both of those indices were going pretty much higher while the NASDAQ flopped around.
For that reason, along with the fact that it's still too soon to tell, we can't quite say that the NASDAQ has really broken out of its range and is ready to make the next move higher. However, we do see that as a distinct possibility. As for how far things might go if this is indeed a real breakout, we'd have to say not too far. The coming months are the slowest time of the year for stocks, and investor optimism is still unsafely high. However, we might see a little more upside before we actually run into those two headwinds.
Our bottom line support is at the 50 day line, or 2300.
NASDAQ Chart

S&P 500 Commentary
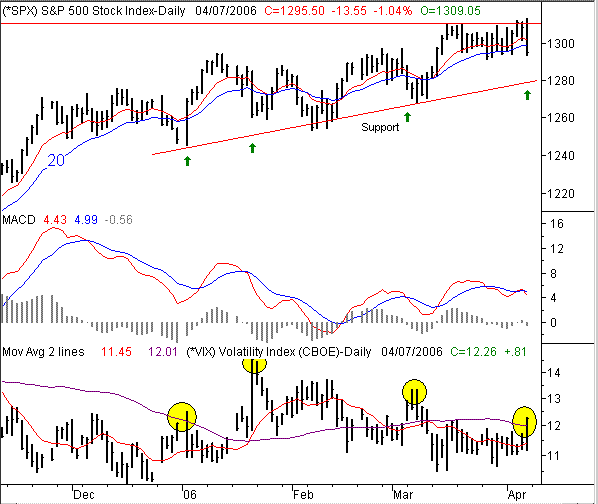
The S&P 500 managed to squeeze out a tiny gain of 0.65 points for the week despite the 13.55 point (-1.04%) pullback on Friday. As with the NASDAQ, a gain that small may as well be called a breakeven, as it sure wasn't impressively bullish. The S&P 500 closed at 1295.50, and under some key short-term moving averages.
Those short-term lines were the 10 and 20 day lines, which had been holding up as support until then. Are we concerned for the bulls? Yes, and no. Anytime you're under the 10 or 20 day average, the short-term trend is clearly not all that positive. However, we also have to keep in mind that we've made several short-term trips under the 10 and 20 day lines since December, yet the SPX has more than recovered from all of them. So no, the bulls don't need to panic yet. The bulls really only need to get worried when-and-if the S&P 500 falls under the support line traced by this year's lows. It's currently at 1280, which leaves some room for a little more selling.
In fact, any recovery may not even need to start from that point - it could start as early as Monday, fueled by Friday's sudden plunge. There are two things setting up that possibility. The first one is that the S&P 500 is very near its 10 day low. Some of the ongoing testing we do here at BigTrends has revealed that in a choppy environment like this one, 10 days is about as far as the market can go in one general direction before switching gears and turning the other way.
The other reason we wouldn't be surprised to see a rally early next week is the CBOE Volatility Index, or VIX. You may recall in our prior Weekly Market Outlook that the one thing the bulls should fear the most is a steady, smooth climb in the VIX chart. In fact, we specifically stated that a volatile VIX spike would possibly spark a rally, rather then send stocks lower. As you can tell with the VIX chart on the bottom part of the image, we got such a spike. The last three times we got a VIX spike like this was at a short-term bottom (see the green arrows), so we have to wonder if the market will make it a fourth. Odds are good that it will, so we're actually thinking like bulls here. Just note that it might take a day or two for any rally to gain some traction.
The key support line from here is 1280. Unless we fall under that, we're probably not going to be able to find much reason to be bearish now that the VIX has moved away from its recent lows near 11.
S&P 500 Chart

Dow Jones Industrial Average Commentary
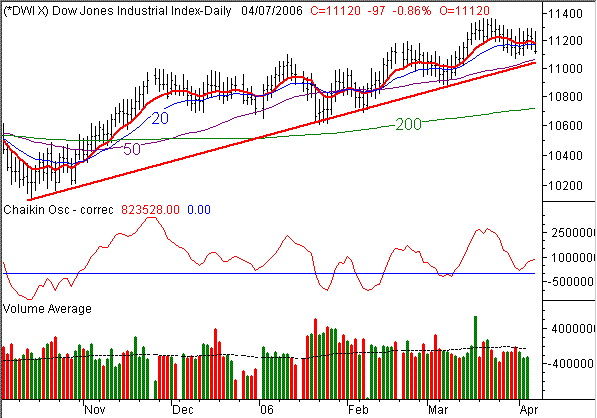
The Dow's 97 point loss (-0.86%) on Friday left it at 11,120 for the week. And like all the indices, that basically meant a breakeven for the blue-chip index. It closed 11 points (+0.10%) above the prior Friday's close.....not much to discuss there.
Despite the fact that the Dow Jones Industrial Average also closed under its 10 and 20 day lines, it's clear that the bigger-picture support line is still in play. It, as well as the 50 day line, is right around 11,080, so we're very close to finding a bounce point here. We'll just point out that this kind of micro-correction has become commonplace for the Dow, so we're not going to flinch with this one. The bigger trend remains bullish until that support line is breached.
Dow Jones Industrial Average Chart

Price Headley is the founder and chief analyst of BigTrends.com.