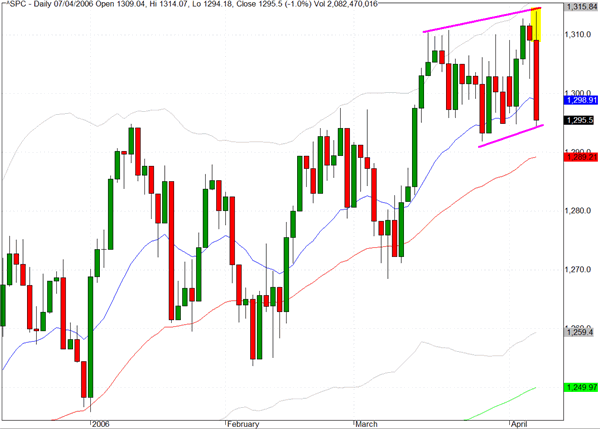
The S&P 500 (^SPC) closed the week with a sharp reversal as it dropped back by 1% to close at 1295 after briefly touching a new multi-year intraday high of 1314 early in the session. Overall it was a negative session for all of the indices, with nasty reversals from new intraday highs also for the Nasdaq Composite and the Russell 2000 which fell by 1.3%, making it the worst performer amongst the broad market indices.
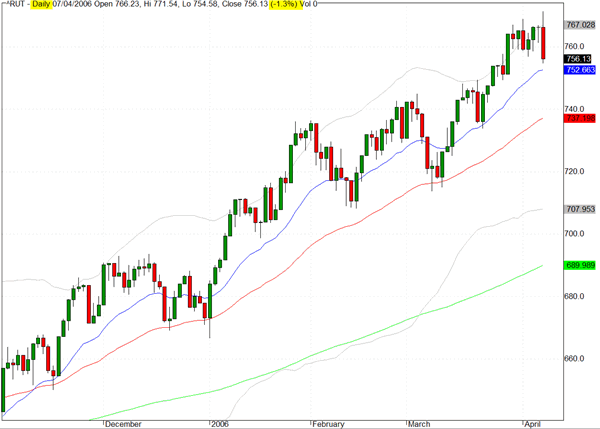
The Russell 2000 (^RUT) which has registered new all-time highs on a frequent basis recently was the worst performer amongst the major indices on Friday. The index lost 1.3% and printed one of the longest red candlesticks for some time, and, as the long upper tail demonstrates, the index achieved a new intraday high at 771 early in the session.
While strong reversals are hardly newsworthy in the current market environment, we would suggest that the action on Friday could have been the precursor to a corrective period for the smaller cap stocks in coming weeks.
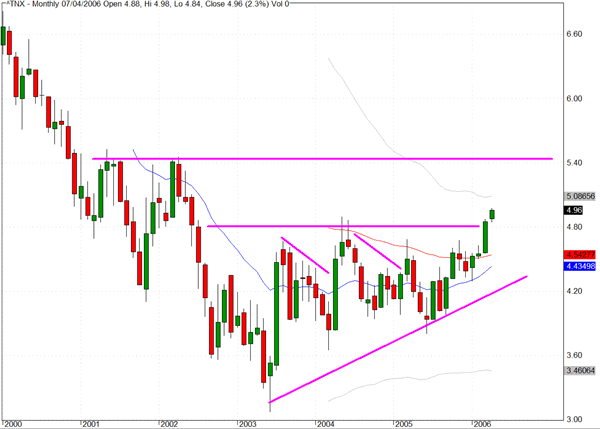
We decided to feature a monthly chart for the yield on the ten year Treasury note extending back to the beginning of the millenium. The yield has now climbed to the 5% level (it actually finished on Friday at 4.96%) and at this level we may witness a respite from the steadily upward trend that has been in place since mid 2003. However, as we have indicated on the chart there is another possible attractor around 5.4% which could undermine the consensus view that we may be close to a new plateau level.
What we have tried to reveal in the trendlines is the notion that higher yields have been resisted quite strongly since the major directional change in 2003, only to be pushed further higher as the Federal Reserve continues hiking short term rates and economic statistics (often strong employment data) continue to point to latent inflationary forces that unsettle Treasury traders.
The reaction to Friday’s data should not have been too surprising as it emulated what has become a fairly consistent pattern in recent months. When the reports reveal that the unemployment rate has fallen yet again, the concerns about capacity constraints resurface and bonds sell off pushing yields up again.
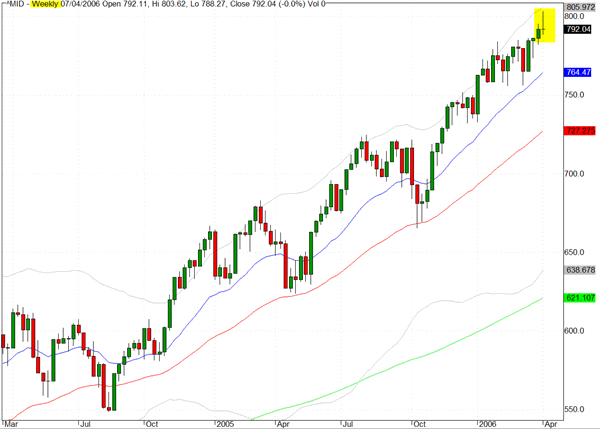
The weekly chart for the S&P Midcap cash index (^MID) covers the last two years and illustrates the remarkable performance that second tier capitalization stocks have enjoyed during this period. We have highlighted last week's candlestick pattern not only because it reveals a Doji formation, where the week's open and close were more or less identical but also the fact that the long upper tail pierced the 800 level and touched the upper volatility band.
It would not surprise us to see a period of consolidation amongst the small and midcap sector of the market as a round of asset allocation revisions may be triggered by the increasing Treasury yields.
TRADE OPPORTUNITIES/SETUPS FOR MONDAY APRIL 10, 2006
The patterns identified below should be considered as indicative of eventual price direction in forthcoming trading sessions. None of these setups should be seen as specifically opportune for the current trading session.
Robert Half International (RHI) has a bearish looking ascending channel following the gap down in late March

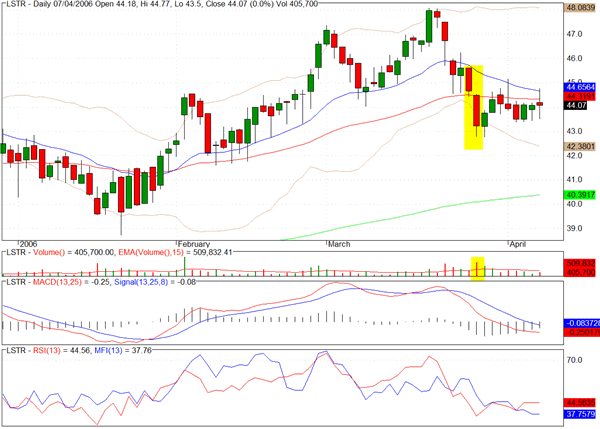
Landstar Systems (LSTR) appears to be stuggling at the intersection of the 20 and 50 day EMA.
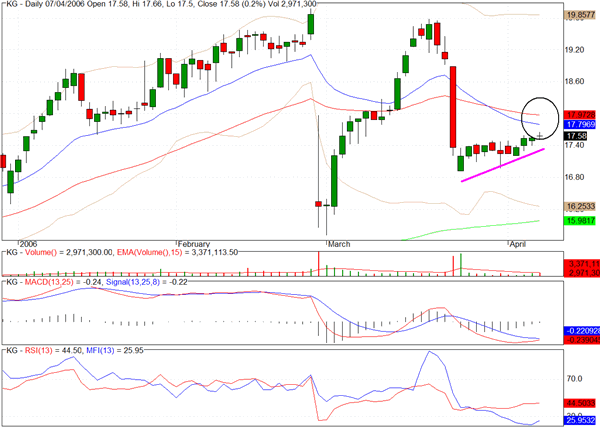
King Pharmaceuticals (KG) has been good for our online portfolio twice in recent months and we sense that another opportunity on the short side may not be far away.
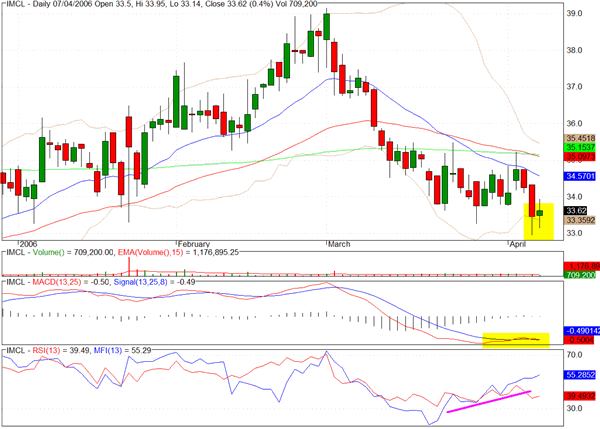
Imclone Systems (IMCL) has positive money flow in conjunction with a basing pattern. We would be targeting the $35 level which is the intersection of the 50 and 200 day EMA.
General Electric (GE) has retreated over the last few sessions on modest volume following the long green candle on heavy volume. There may be slightly more than a dollar of upside potential

Clive Corcoran is the publisher of TradeWithForm.com, which provides daily analysis and commentary on the US stock market. He specializes in market neutral investing and and is currently working on a book about the benefits of trading with long/short strategies, which is scheduled for publication later this year.
Disclaimer
The purpose of this article is to offer you the chance to review the trading methodology, risk reduction strategies and portfolio construction techniques described at tradewithform.com. There is no guarantee that the trading strategies advocated will be profitable. Moreover, there is a risk that following these strategies will lead to loss of capital. Past results are no guarante of future results. Trading stocks and CFD's can yield large rewards, but also has large potential risks. Trading with leverage can be especially risky. You should be fully aware of the risks of trading in the capital markets. You are strongly advised not to trade with capital you cannot afford to lose. This article is neither a solicitation nor an offer to buy or sell securities.