To the delight of US investors, the S&P500 achieved another step into 4+ year highs this past week. While both the DOW and the NASDAQ-100 continue to trail the S&P500, they are not too far behind their own multi-year high points. This has been quite a recurring theme throughout the last couple of years in the US Equity markets indicating that the entry of money into equities is broad-based in nature. This is probably due to a combination of the ever-increasing popularity of Index Funds and ETF's as legitimate long-term investment instruments, together with strength of International Equities.
Despite the overall ideal, upward motion of the US Equities, it has become quite clear that the US is trailing behind the rest of the world's equity markets, many of which are already into their all-time high territories. The Stock Markets in the Far East in particular are quite strong in comparison, as it seems the great "Asian Economic Contagion" of the mid-to-late 90's is now increasingly becoming a distant memory. A similar situation goes for Latin America. Not only have the stock markets there and others worldwide gone to new heights, leaving behind what "was" the mighty US Stock Market, but the world currencies have picked-up strength against the dollar as well. What could be happening?
We can go on for pages upon pages of discussion, but to put it in as simple terms as I possibly can, the weakness in the financial state of the US versus the rest of the world is as natural as the daily alternation between sun and moon. It wasn't very long ago when the US was leading the world into new highs as far as Equities and strength of currency was concerned, while the rest of the world lagged behind. The opposite scenario is now in full-force, as the charts have made it quite clear. Between the stronger Asian and Latin American markets versus the US, Europe seems to be caught in the middle, although still outperforming the US Equity market. The charts across the board are clearly suggesting that the US is well within an economic bust cycle relative to worldwide-performance, the end of which depends on so many complex factors that is beyond the scope of our coverage this week. However, we do have a few charts to take a look at that paint the correct overall picture. Let's take a look:

Chart Notations
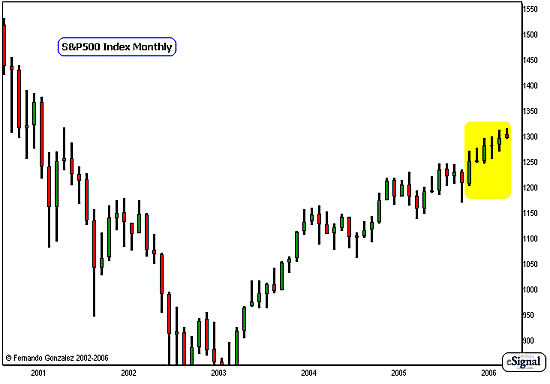
- The Monthly chart of the S&P500 above addresses the Long-term time horizon (1 yr or more)
- The move to new multi-year highs this week is not accompanied by much fanfare as this has been quite a recurring theme throughout the last 6 months. Notice however, that these set of advances to new highs (yellow) just inch along at a relatively quiet pace. This upward motion would be just great if only this upward motion in the US Equity markets that has been going-on for 3 years is not dwarfed by the preceding sell-off that began in year 2000. This is the part that is a concern for the coming years, as we will see in our charts next, this upward movement on the part of the S&P500 seems to just be chiming along with the world markets, which are due for some corrective action soon.

Chart Notations
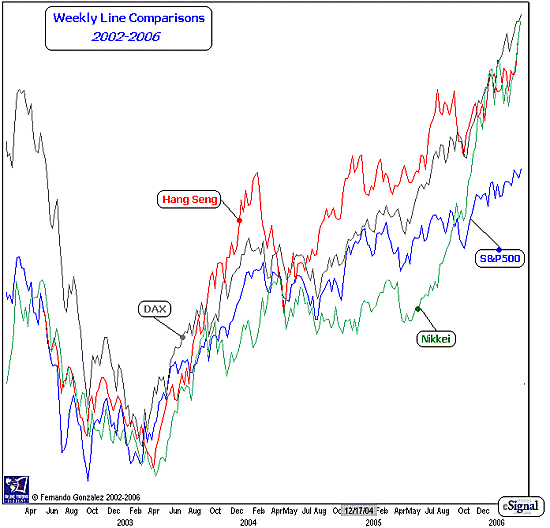
- The Weekly line comparison charts of some major World Indices above addresses the Intermediate-Term time horizon (~ 6-12 mos.)
- Notice that the S&P500 (blue) has over the last 18 months begun to trail behind other major measures of the world, many of which are in full-blown, long-term Bull markets. Because of some problems I was having with my charts, I am not able to apply an accurate scale here - thus, the image we see above actually gives a better picture of the S&P500 than it actually is, in percentage terms. Many of the world markets are far more ahead than I can actually (and accurately) show here. This is quite a concern I have for the US market, as every bit of experience I have in charting and measuring relative strength tells me that once the upside leaders have found their resistance, the S&P500, being the big laggard here, is going to have some real trouble finding Bids. The rallies in the Asian and Latin American markets are part of full-blown Bull markets that are bordering on parabolic behavior, and thus are entering high-risk environments susceptible to sharp, but quick corrective action. Let's note that in almost 3 years, the S&P500 has had no meaningful correction, and thus 2006 is likely to be the year that we will see some sharp downward corrective activity in the S&P500, and thus for most US Equities.

Chart Notations
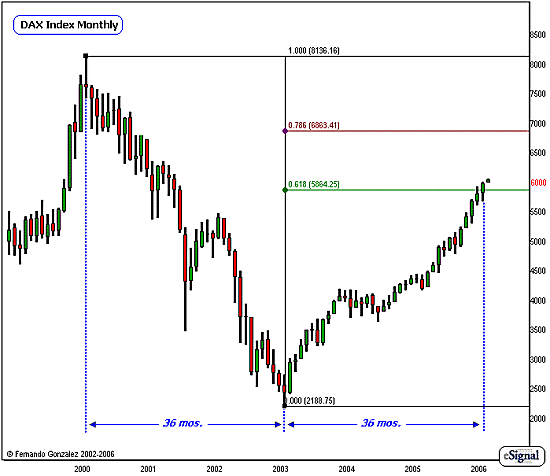
- The Monthly chart of the German DAX Stock Exchange Index, addresses the Intermediate-to-Long-term time horizon ( ~ 6 to 18 months)
- As mentioned earlier, the European market tends to be caught between the relative weakness of the US and the relative strength of other World Markets. It is however, in percentage-of-value terms, carrying relative strength versus the US. The DAX above has returned close to 200% since its low-point in 2003. It also just recently poked through the very technically-significant 62% Fib retracement of its 2000-2003 decline. Another very important measurement is Time: as this market has now spent equal amount of time during its bounce (36 months, marked in blue), as the time it consumed to decline. And thus this market is now at an important cross-road in price and time. Although the market is not likely to find an immediate and tremendous amount of resistance, the 62% Fib retracement mark is likely to serve as a long-term resistance AREA where the market is likely to lose its upward momentum and go into corrective behavior. Because it is leading the S&P500 upward, this could spell trouble for the US markets, as these are very inter-related. These are just some evidence that suggest the lagging US markets are likely to experience some tough times in 2006, tougher than any it has seen its low-point in 2002.
Until next week: Good Luck!
Fernando Gonzalez is in his 10th year as an active trader, technical analyst and content contributor to the active trading community and a long list of popular financial media. Online Trading Academy trading knowledge...your most valuable form of capital.