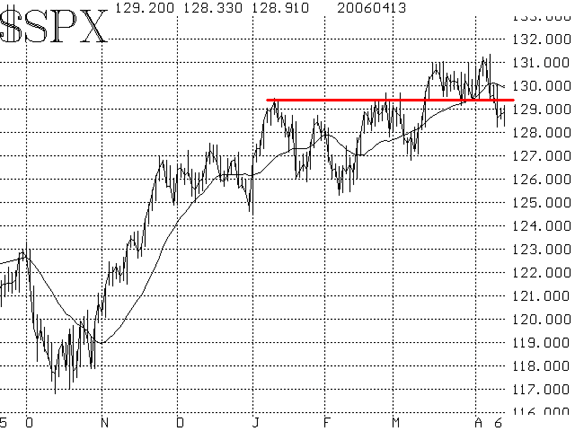
Even though the broad market kept making marginally higher highs over the last month, the bulls never were able to capitalize and stage a true upside breakout. Eventually, the market topped in a rather traditional way -- quietly, and on good news. Last Friday, after a unanimously agreed-upon positive Employment Report, $SPX traded to a new, nearly 5-year high. But then, selling developed, and the market collapsed that day -- completing a negative intraday reversal. After temporizing on Monday, more selling swamped the markets on Tuesday, and that was the day that plunged $SPX below the support levels at 1290-1295. That area continues to be a demarcation line. Even though the selling stopped as the holiday weekend approached, we would expect the bears to make further downside attempts soon. The $SPX chart (Figure 1) not only shows a breakdown, but the 20-day moving average has rolled over, near the 1300 level, and is trending lower as well.

The over-riding question, though, is "Will this just be another false breakdown?" As we've repeatedly noted, this market is historic in its failure to follow through on breakout moves (witness the false upside breakout last Friday). So now the onus is on the bears to produce. We should know rather quickly -- early next week -- if they are up to the task or not. Our guess is they will be.
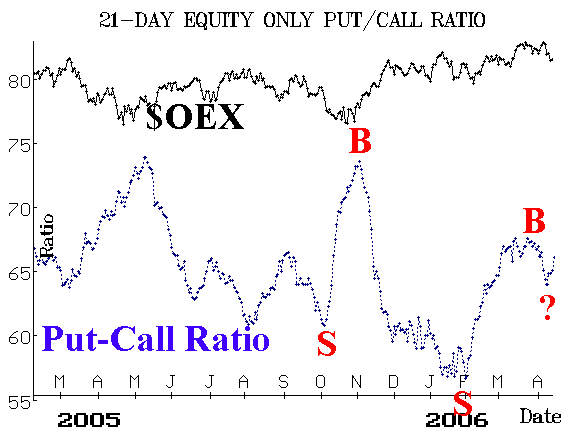
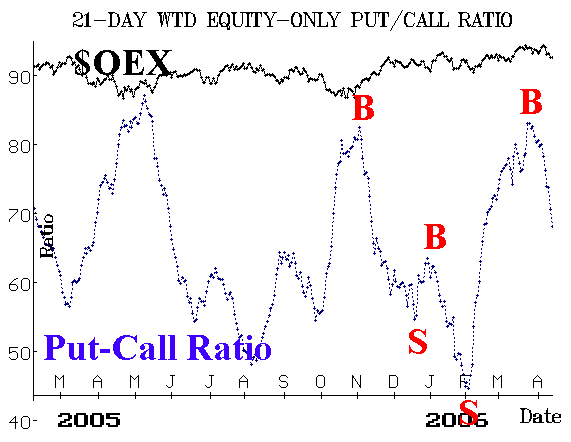
The equity-only put-call ratios are mixed. The weighted ratio, Figure 3, is still solidly on a buy signal (and thus is the most bullish of all our indicators at the present time), but the standard ratio, Figure 2, looks like it's begun to roll over to a sell signal. However, our computer projections do not yet confirm a sell signal from the standard ratio.


Breadth (advances minus declines) continues to swing about wildly, following the market in whichever direction it goes. Note the three days of heavily negative breadth as the market was breaking down earlier this week.
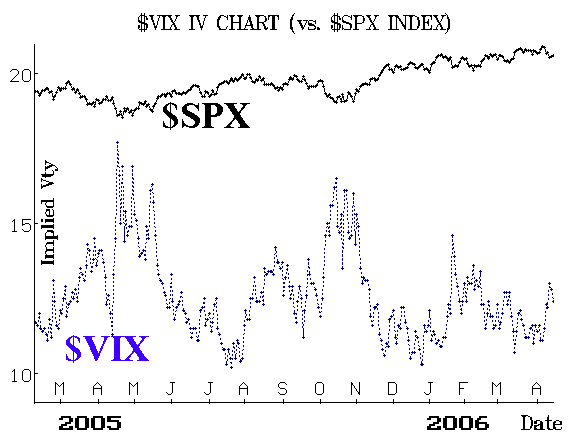
Finally, $VIX clawed its way up to 13 when the market broke down. This was a minor breakout of sorts (see chart, Figure 4), but it's such a small move that it doesn't really create an uptrend -- which would be required for a more bearish stance.

In summary, the indicators are more negative than they had previously been, but they are not uniformly on sell signals. The best thing to watch right now is how $SPX performs: it's bearish if it continues to close below 1290, it's neutral between 1290 and 1300, and a close above 1300 would indicate that -- once again -- a false breakdown had occurred.
Lawrence G. McMillan is the author of two best selling books on options, including Options as a Strategic Investment, recognized as essential resources for any serious option trader's library. Sign up today and take an extra 10% off tuition for Larry's 2-Day Intensive Options Seminar on May 20 & 21 in Houston.