NASDAQ Commentary
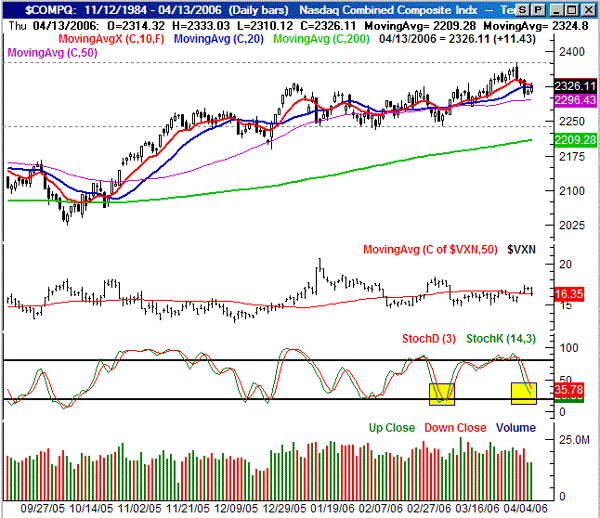
The NASDAQ Composite actually had a pretty decent gain on Thursday, gaining 11.43 points to end the shortened week at 2326.11. That's still a net loss of 12.91 points (-0.55%) for the week though, largely thanks to a disastrous Tuesday.
But, as we mentioned in the MidWeek Update, the losses taken between Friday of two weeks ago and Tuesday of last week really pushed the limits, so to speak. Traders have generally stayed in bullish mode for the better part of 2006, meeting each big dip with an even bigger buyback. The 51 point loss over those three trading days pretty much matches the 'average' dip we've seen all this year, and each of those was met with some pretty solid buying. So, we basically expect to see a repeat of that this time around.
The most immediate question mark for the NASDAQ is the 10 day moving average line, currently at 2329. The composite managed to trade above that mark for a while on Thursday, but couldn't stay above it when the closing bell rang. Although the chart is setting up a bullish move, we'd be hesitant to dig in too deep until we closed above the 10 day line. That could happen as early as Monday though.
As for where it might end if the bulls finally do get some traction, set your first target at the recent 52-week high of 2375. If the NASDAQ manages to get past that, a move closer to 2400 or higher isn't completely out of the question.
As for support, the 50 day line at 2296 is a starting point. However, it hasn't been all that precise as support, so that's a loose support level at best. The lows at 2240 make a better support line, despite the fact that they're 86 points under the current level.
As for 'bigger picture', and rally the market manages to make now may be the last big one for a while. The spring/summer period is typically slow, and stocks have a hard time going anywhere. Pair that up with the fact that we're sitting on some pretty good-sized gains already, we wouldn't be surprised if the bulls yielded to the bears after this one last rush.
NASDAQ Chart

S&P 500 Commentary
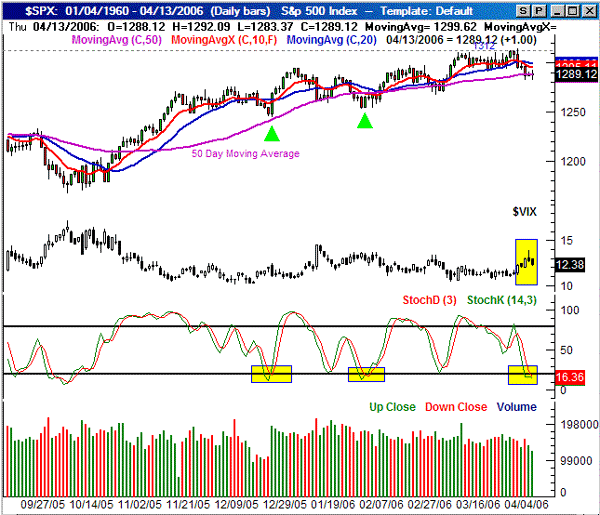
The S&P 500's close at 1289.12 on Thursday was the result of a 6.38 point loss for the four day week (-0.5%). However, most of that loss was inflicted on Tuesday, while the last two days of the week were actually mildly bullish. The index still closed under the 10 and 20 day lines, which is technically bearish. However, we've seen the SPX fall under the 10 day line four different times this year, and none of those times really turned into a significant selloff. So, that's why we're not even going to entertain the bearish idea this time around. If anything, we have better reasons to be bullish.
Thursday's close (and Tuesday's and Wednesday's for that matter) were all right at the 50 day line. While it's not been a perfect support line this year, it's been pretty darn close, sending the S&P 500 chart higher each time it's been hit. It looks like the bulls are working to make that happen again, with the major selloff being abruptly halted there. But that's not all.
The CBOE Volatility Index (VIX) has indeed peaked as of Wednesday. It opened lower, reached a high of 13.90, then closed at 13.06. The bar shape is an upside-down hammer - the first sign of a reversal. The next day (Thursday), the VIX fell al the way to 12.38. Stock obliged by starting to head higher, although not with quite as much conviction. We think the SPX will keep heading higher now that the VIX is pointed lower when regular trading restarts on Monday.
By the way, we now have a third bullish catalyst in play in the stochastic lines. They became officially 'oversold' on Thursday, priming the S&P 500 for a rebound, as they did on January 3rd and February 8th. Those rallies were good for a 25 to 35 point gain, which is about the same size move we'd expect this time around. From Thursday's close, that would put the SPX around 1310.....right where the index topped out a couple of times in the last three weeks. That said, each of the recent surges has also pushed the index into new highs, so there's certainly the potential for a little more than the 1310 level. However, we can't say it would be a gain of a whole lot more than that. We're entering into the slower period of the year soon, and that will make it tough to sustain a rally.
S&P 500 Chart

Dow Jones Industrial Average Commentary
The scenario is about the same for the Dow as it was for the NASDAQ and the S&P 500, so we won't over-describe what we see on the Dow's chart. Basically, we think the selling pressure has subsided, and the bulls are gearing up for a decent upward move.
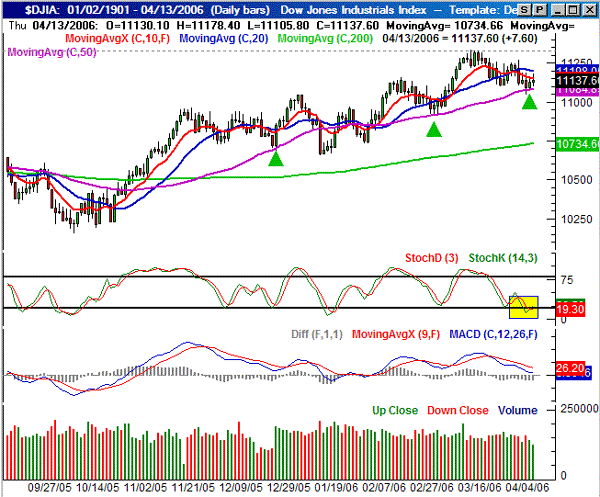
The one thing we'll highlight here is that the 50 day line has been near-perfect as support for the DJIA. plotted in purple below, the 50 day line has been the precise bounce point on three separate occasions over the last few months. Granted, it wasn't the bounce point in late January, but the odds still favor viewing it as one now. Plus, being stochastically oversold is making this chart ripe for an upside move, like we saw in late January and early March.
Like the NASDAQ, we'd feel a lot better about being bullish once we saw a close above the 10 day line. It's currently at 11,152. And really, a close above the 20 day line at 11,198 would be better. As for hoe far the Dow could go once unleashed, the last few bullish moves have been on the order of 200 to 400 points. That means the blue-chip index could see 11,400 or so within a couple of weeks. Yes, that's a new 52-week high, and should be tough to do. However, we'll remind you that the last three big bullish legs have al taken the Dow to new multi-year highs. So, it's not as big of a barrier as you might think.
That said, keep a close eye on things when-and-if we get to 11,300. That's the most recent high spot.
As for support, the 50 day line at 11,086 is the line in the sand.
Dow Jones Industrial Average Chart

Price Headley is the founder and chief analyst of BigTrends.com.