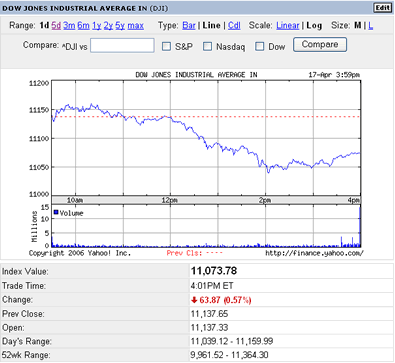
The bulls had a tough day in the market yesterday unless they were in a handful of sectors including oil, energy, and basic materials. The markets started off fairly flat, then began tanking at about 12:30 EST. The Dow (pictured below), NASDAQ, and S&P all closed lower.
The selling pressure was mainly attributed to the three culprits I have mentioned the past few trading days...Oil, Gold, and the 10-year treasury yield. Oil surpassed 70 per barrel yesterday and is currently trading at 70.80, while gold has ramped up to 616.30 per ounce. The yield on the 10-year has managed to pull back below 5%, currently 4.98%. These indicators will continue to weigh down the markets positive news until one or two of them gives. When this will happen is anyone's guess. Keep in mind this does not necessarily mean that the markets will continue to fall, they just may not be able to get the buying momentum expected on good earnings and positive growth stories.

Today, we have several companies releasing earnings. Most have already released their reports with a majority of them beating estimates. A few firms fell short, Mattel (Ticker: MAT) being the worst. Keep an eye on the Consumer Cyclicals sector today. In an environment like the one we are facing at present, Consumer Cyclicals have a tendency to take big losses.
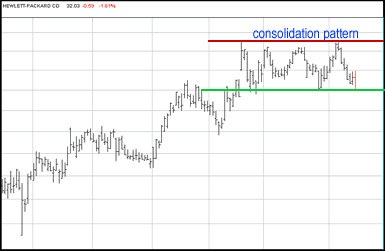
Hewlett-Packard Co (Ticker: HPQ) was trading in an up trend before moving into a consolidation pattern. The pattern consists of support at 32 and resistance at 34.50. The selling pressure that existed in yesterday's market pushed HPQ down to the 32 support level, closing at 32.04.

HPQ's downside move to support may present a buying opportunity. I am going to do a complete analysis on this stock and decide if HPQ is worth taking a position in.
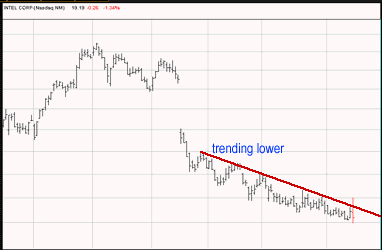
Intel Corp (NASDAQ: INTC) has not been doing so well for quite some time now. Take a look at the 6-month daily bars chart below. As you can see, INTC gapped down huge before starting a down trend. This downtrend has been tested several times with success. In yesterday's trading session, INTC tried to make a move outside of the trend, but was unable to close beyond the trend line.

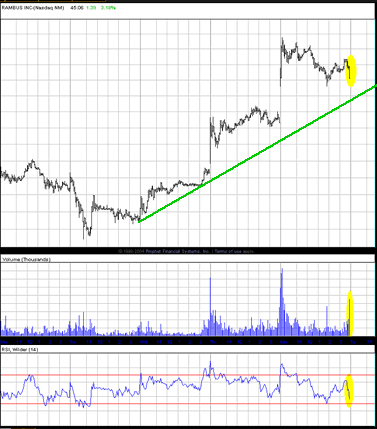
Rambus Inc (NASDAQ: RMBS) has shown relative strength to the rest of the market for several days now. The strength was truly revealed when the stock was able to hold onto gains of about 3% in yesterday's sell off. Will RMBS continue to rally, or will the stock come down some before the weeks end? It's thought to bet against a stock that has been as strong as RMBS the past few days. One indicator of weakness that comes to mind when looking at the 5-day 5-minute chart is the high volume sell off. The sell off occurred at the end of yesterdays trading session, while the rest of the market was seeing buying interest. That said, an offset to this indicator is the low RSI level (highlighted in yellow at the bottom of the picture below). It appears that RSI tends to move to the upside when reaching these levels.

Andy Swan is co-founder and head trader for DaytradeTeam.com. To get all of Andy's day trading, swing trading, and options trading alerts in real time, subscribe to a one-week, all-inclusive trial membership to DaytradeTeam by clicking here.