The last several days in U.S. Equities have been dominated by plenty of selling pressure, following what was only last week a "crawl" to new multi-year highs in the S&P 500. The DOW and Nasdaq remained a few steps behind, not being able to take-out their respective year-to-date highs. However, what is perceived as plenty of selling pressure over the last several days is really not all that notable, when we consider how this builds-in to the overall short-term, and even Intermediate-term picture. As noted here several times over the course of the last few months, US equities are gripped by a very tight trading range unseen (in percentage-terms) in over a decade. It now enters 5 months into this tight trading range which has yielded mediocre trading conditions. This is a prolonged stand-off between Bulls and Bears. Exactly how long this will continue will be anyone's guess. With a reasonable amount of confidence however, we can say that the majority of this bout of absence in volatility is much more than halfway done, and that the widest and 'more exciting' trading ranges of 2006 are still ahead of us.
Let's take a look at the Daily charts of the S&P 500 and Nasdaq and see how the market has progressed over the course of the last few months, and then later, we will take a look at the Gold markets, which is perhaps the "hottest" market this year:

Chart Notations
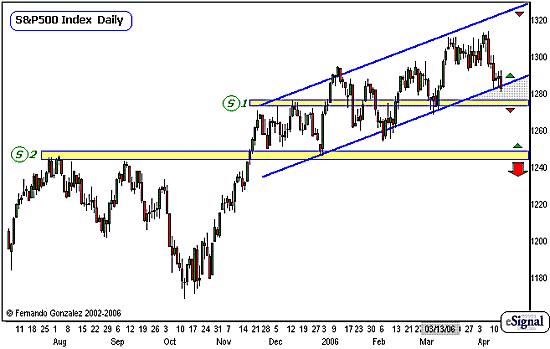
- The Daily chart of the S&P 500 above addresses the Short-Term time horizon (3 mos or less)
- As most of you might already know, the single most important barometer for US Equities is the S&P 500, and the view we see above illustrates its behavior over the 9 months. The ranges we see here are extremely tight and are dwarfed by the preceding volatility of the last several years. 2006 is the "sleepiest" year for stocks in over a decade.
- The last 5 or so months have been particularly tight, although its trend has been quite consistent. The slow series of higher-highs and higher-lows (represented by the blue channel lines) has been quite a recurring theme, and the decline over the last several trading days takes this market right to the bottom area of the channel. Let's note that the channel is there just to represent the series of higher-highs and higher-lows, more than represent a specific "line" of diagonal support or resistance.
- The more significant area of support is marked as S1, just below the 1280 mark. With a market as choppy as what we have seen over the last 5 months, it's difficult to set precise levels of Support or Resistance - in that case we have to leave room for flexibility here, as a choppy market will generate many false signals.
- We mark-off the gray area as a Neutral zone. Trading back inside the channel returns the market back to the direction of its trend and thus puts into play a move towards the top of the channel.
- If the market is able to sustain trade below the S1 mark, then we look for further downward progress into S2, where a more significant area of Support awaits.

Chart Notations
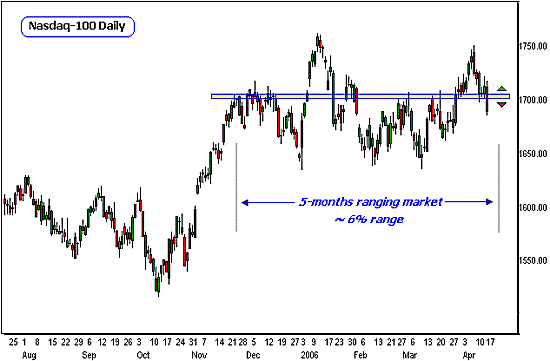
- The Daily chart of the Nasdaq above addresses the short-term time horizon (3 months or less).
- The tight range of the last 5 months is best represented in the Nasdaq, and marked accordingly on the chart.
- Notice that the market has been gripped by this tight range, which is very much unlike its action over the last several years. This range comprises about 6% of the value of the Nasdaq... it is tough to see the Nasdaq half-dead like this, considering 6% PER DAY not too long ago was not all that uncommon.
- The recent declines in the market have taken the Nasdaq down below the Half-way mark of its 5-month trading range (marked in yellow, at around the 1700 level).
- At this point, sustained trading below the half-way mark gives the Bears the upper-hand, and a move to the bottom of the range into play.

Chart Notations
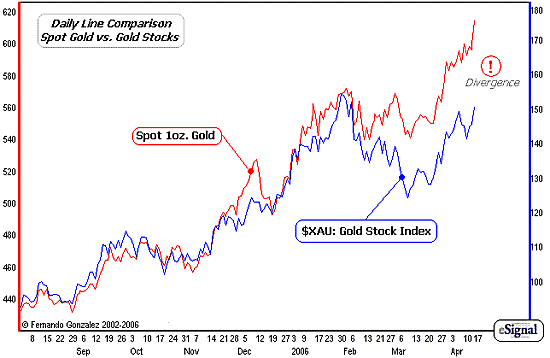
- The Daily line chart above compares Spot Gold (red) and the Gold/Silver Stock Index ($XAU, in blue). My notations below will address the Short-Term time horizon (less than 3 months)
- Up until approximately January of 2006, Gold stocks have been strongly tied to the price progress of Spot Gold. Spot Gold continues on the rampage, and has recently moved the key milestone mark of $600.
- Note however that over the last several weeks Gold Stocks have begun to trail behind Spot Gold.
- As Spot Gold moves strongly into multi-decade highs, this is a time where short-term risks are beginning to pick up in that market. The divergence above signals some short-term problems just ahead in the trend of Gold, where I feel the risk to corrective activity exceeds trend continuation. We identified this strong move several months ago and have written about it a number of times. This is a time however, where I feel that the market has moved up fast, and is thus vulnerable to corrective behavior. While this does not affect a much larger bullish expectation I have on Gold over the long-term, the short-term carries some extra-ordinarily high risks - let's keep this in mind, as the fanfare is in full motion.
Fernando Gonzalez is in his 10th year as an active trader, technical analyst and content contributor to the active trading community and a long list of popular financial media. Online Trading Academy trading knowledge...your most valuable form of capital.